• NUCLEAR TECHNIQUES
  • Vol. 46, Issue 2, 020202 (2023)
Yubo XING1、2, Zhiping ZOU1, Ruizhu YANG2, Wei MA1, Liping ZOU1, Liang LU1, and Zhen YANG1、*
Author Affiliations
  • 1Institute of Sino-franco Nuclear Energy, Sun Yat-sen University, Zhuhai 519082, China
  • 2The Science and Technology on Surface Physics and Chemistry Laboratory, Mianyang 621908, China
  • show less
    DOI: 10.11889/j.0253-3219.2023.hjs.46.020202 Cite this Article
    Yubo XING, Zhiping ZOU, Ruizhu YANG, Wei MA, Liping ZOU, Liang LU, Zhen YANG. Quantitative determination of hydrogen isotopes using laser-induced breakdown spectroscopy[J]. NUCLEAR TECHNIQUES, 2023, 46(2): 020202 Copy Citation Text show less
    Schematic diagram of LIBS optical system
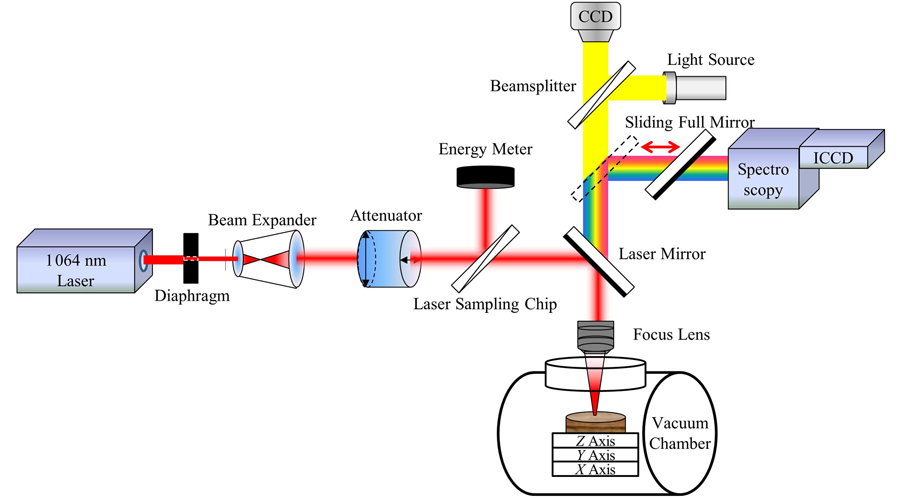
    Fig. 1. Schematic diagram of LIBS optical system
    Schematic diagram of the vacuum system
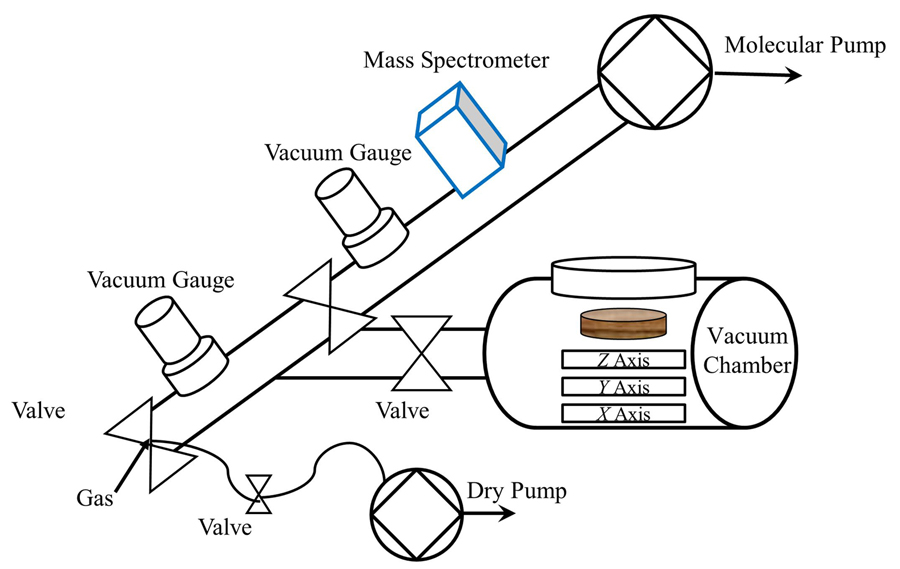
    Fig. 2. Schematic diagram of the vacuum system
    LIBS spectrum of TiH0.5D0.5 at the wavelength of 300~700 nm
    Fig. 3. LIBS spectrum of TiH0.5D0.5 at the wavelength of 300~700 nm
    LIBS spectrum of Ti element in TiH0.5D0.5 in the range of 498~502 nm
    Fig. 4. LIBS spectrum of Ti element in TiH0.5D0.5 in the range of 498~502 nm
    The characteristic spectrum of HD in the sample TiH0.5D0.5
    Fig. 5. The characteristic spectrum of HD in the sample TiH0.5D0.5
    Calibration curve of hydrogen atomic content
    Fig. 6. Calibration curve of hydrogen atomic content
    Calibration curve of deuterium atomic content
    Fig. 7. Calibration curve of deuterium atomic content
    Calibration curve of hydrogen atomic content after integrated intensity correction
    Fig. 8. Calibration curve of hydrogen atomic content after integrated intensity correction
    Calibration curve of deuterium atomic content after integrated intensity correction
    Fig. 9. Calibration curve of deuterium atomic content after integrated intensity correction
    激光波长 Laser wavelength/ nm激光能量Laser energy / mJICCD延迟时间ICCD delay time / ns曝光时间Exposure time / ms门宽 Gate width/ μs增益Gain背景气氛Background atmosphere背景压强Background pressure / Pa
    1 0641010010 00052 000He3 000
    Table 1. Experimental parameters of LIBS
    λ / nmEm / cm-1Amn / 107gmEm / eV
    498.173 026 910.7096.60133.334 236 845
    499.106 626 772.9685.84113.317 170 735
    499.950 126 657.4165.2773.302 853 842
    500.098 836 096.5423.6574.472 361 554
    500.720 626 564.4004.9273.291 329 160
    506.465 120 126.0620.43772.493 619 082
    Table 2. Spectral constant information of Ti characteristic line
    编号No.123456
    温度 / KTemperature15 93015 86515 59515 34416 85716 516
    Table 3. Plasma temperature of TiH(D) sample
    分析方法 Analysis methodNo.1No.2No.3No.4No.5No.6
    压降法-氢含量 Pressure drop method - hydrogen content5.419.2915.5223.4641.7553.11
    LIBS标定-氢含量 LIBS calibration - hydrogen content4.048.0818.2726.6834.7656.74
    LIBS测量-氢误差 LIBS measurement - hydrogen error1.381.212.743.216.993.63
    压降法-氘含量 Pressure drop method - deuterium content48.7245.2336.2223.4617.895.90
    LIBS标定-氘含量 LIBS calibration - deuterium content47.2048.8734.9023.1315.258.09
    LIBS测量-氘误差 LIBS measurement - deuterium error1.523.631.330.332.642.19
    Table 4. H and D quantitative analysis results in samples (%)
    检测法Test methodsHD
    峰值强度法 Peak intensity method2.252.80
    积分修正法 Integral correction method1.011.22
    Table 5. Limit of detection of hydrogen isotope (%)
    Yubo XING, Zhiping ZOU, Ruizhu YANG, Wei MA, Liping ZOU, Liang LU, Zhen YANG. Quantitative determination of hydrogen isotopes using laser-induced breakdown spectroscopy[J]. NUCLEAR TECHNIQUES, 2023, 46(2): 020202
    Download Citation