
Li-Ya Pei. Enhanced third-order nonlinear processes based on Raman resonance [J]. Acta Physica Sinica, 2020, 69(16): 164203-1
- Acta Physica Sinica
- Vol. 69, Issue 16, 164203-1 (2020)
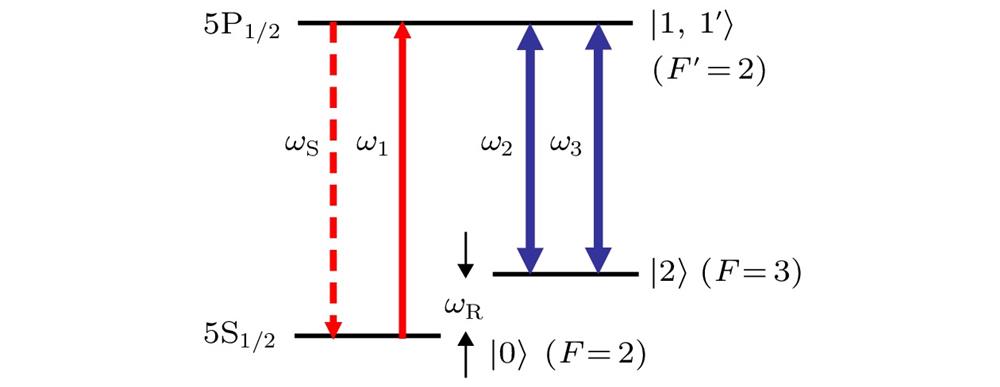
Fig. 1. D1 line energy-level diagram of 85Rb.
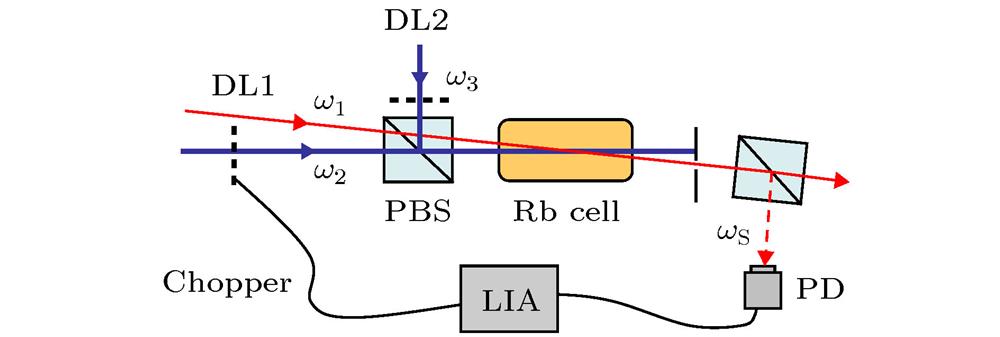
Fig. 2. Experimental setup. DL1 and DL2, diode lasers; PBS, polarizing beam splitter; PD, photodetector; LIA, lock-in amplifier.
Fig. 3. Experimental results for the transmission intensity of the weak probe beam (black solid line) and the FWM signal with narrow linewidth (red solid line) as a function of Δ 1: (a) Δ 2 = 0; (b) Δ 2 = 350 MHz. (Note that in order to see the details clearly, the spectral intensity in Fig. (b) is the result of magnification to 2.5 times the actual situation.)
Fig. 4. Experimental results (red star) and theoretical fitting (black solid line) for the FWM signal. The coupling field intensity I 2 = 1.97 mW and the control field intensity I 3 = 7.4 mW are used in the experiment. The parameters used in the theoretical simulation are
 ,
,
 ,
,
 ,
,
 .
.
,
,
,
. Fig. 5. (a) FWM (solid line) and SRS (dotted line), and (b) corresponding resonant velocities
 (solid line) and
 (dotted line) as a function of
 when
when
 (black), 2.5(red), 4.0(blue).
(solid line) and
(dotted line) as a function of
when
(black), 2.5(red), 4.0(blue). Fig. 6. (a) FWM (solid line) and SRS (dotted line), and (b) corresponding resonant velocities
 (solid line) and
 (dotted line) as a function of
 when
when
 50.7 (black), 101.4(red), 202.8(blue).
(solid line) and
(dotted line) as a function of
when
50.7 (black), 101.4(red), 202.8(blue). 

Set citation alerts for the article
Please enter your email address

© Copyright 2018-2021 | Chinese Laser Press. All Rights Reserved 沪ICP备15018463号-20