Journals
Advanced Photonics
Photonics Insights
Advanced Photonics Nexus
Photonics Research
Advanced Imaging
View All Journals
Chinese Optics Letters
High Power Laser Science and Engineering
Articles
Optics
Physics
Geography
View All Subjects
Conferences
CIOP
HPLSE
AP
View All Events
News
About CLP
Search by keywords or author
Login
Registration
Login in
Registration
Search
Search
Articles
Journals
News
Advanced Search
Top Searches
laser
the
2D Materials
Transformation optics
Quantum Photonics
Journals >
Resources Science >
Volume 42 >
Issue 6 >
Page 1135 > Article
Resources Science
Vol. 42, Issue 6, 1135 (2020)
The influence of vacancy rate on housing price: Based on panel data of 35 key cities
Jie WANG and Jiliang ZHANG
*
Author Affiliations
School of Economics, Nanjing University of Finance and Economics, Nanjing 210023, China
show less
DOI:
10.18402/resci.2020.06.11
Cite this Article
Jie WANG, Jiliang ZHANG.
The influence of vacancy rate on housing price: Based on panel data of 35 key cities
[J]. Resources Science, 2020, 42(6): 1135
Copy Citation Text
EndNote(RIS)
BibTex
Plain Text
show less
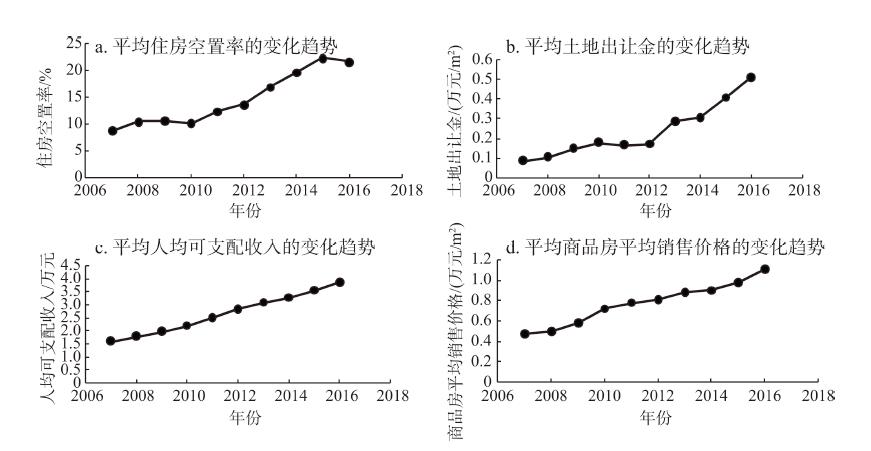
Fig. 1.
Trends of average value of the indices, 2007-2016
Download full size
|
View in the Article
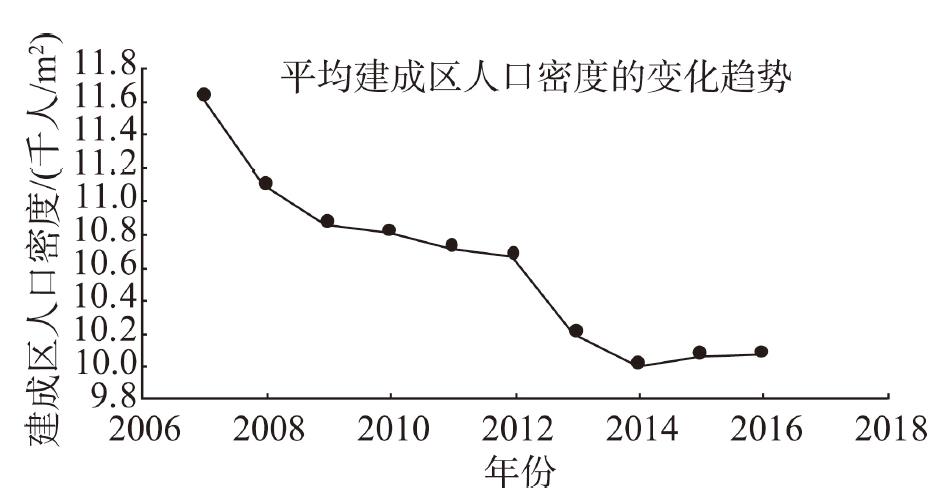
Fig. 2.
Trend of average population density in built-up areas, 2007-2016
Download full size
|
View in the Article
一线城市
二线发达城市
二线中等发达城市
二线发展较弱城市
三线城市
北京
天津
济南
合肥
乌鲁木齐
上海
杭州
大连
南昌
贵阳
广州
南京
哈尔滨
南宁
海口
深圳
重庆
沈阳
昆明
兰州
青岛
西安
石家庄
银川
宁波
长春
太原
西宁
厦门
长沙
呼和浩特
成都
福州
武汉
郑州
Table 1.
City classification
城市
ln
HVR
的
系数(
P
值)
ln
LTF
的
系数(
P
值)
ln
PCDI
的
系数(
P
值)
ln
PD
的
系数(
P
值)
北京市
-0.3864(0.1897)
0.0164(0.8647)
0.9141(0.0009)
0.8733(0.0739)
天津市
-0.1159(0.0031)
0.1849(0.0003)
0.8118(0.0000)
0.0135(0.9560)
石家庄市
-0.2135(0.1525)
0.2509(0.3419)
1.7443(0.0008)
-1.2583(0.2397)
太原市
-0.0071(0.9716)
0.2839(0.2202)
1.7505(0.0470)
1.7536(0.4432)
呼和浩特市
-0.1539(0.3088)
0.0456(0.7013)
1.0118(0.0000)
0.3786(0.3338)
沈阳市
-0.3135(0.0000)
0.1080(0.0398)
0.9821(0.0000)
0.0374(0.8425)
大连市
-0.0015(0.9774)
-0.0051(0.9269)
0.5029(0.0005)
-0.2624(0.1381)
长春市
-0.1818(0.0156)
0.1469(0.1111)
0.6445(0.0000)
-0.0535(0.8894)
哈尔滨市
-0.0954(0.7215)
0.3370(0.0100)
0.2206(0.3100)
-1.1876(0.1075)
上海市
-0.1628(0.6177)
0.4383(0.0170)
-0.5668(0.4412)
4.4425(0.1476)
南京市
-0.3762(0.0165)
0.3046(0.0089)
1.1192(0.0270)
5.9428(0.0095)
杭州市
-0.4349(0.0433)
0.0324(0.8158)
2.0592(0.0040)
-1.1670(0.0043)
宁波市
-0.322(0.0000)
0.1343(0.0038)
1.0449(0.0000)
-0.5854(0.0000)
合肥市
-0.048(0.9272)
0.0819(0.6602)
0.8419(0.0811)
-0.8534(0.2803)
福州市
-0.0268(0.8640)
0.0641(0.5489)
0.5811(0.0548)
-1.1301(0.0565)
厦门市
-0.2167(0.6229)
0.1804(0.1011)
1.6614(0.1510)
0.2725(0.8523)
南昌市
-0.0720(0.6462)
0.0251(0.8736)
1.2362(0.0491)
0.4931(0.7261)
济南市
-0.2925(0.0418)
0.0034(0.9844)
0.7805(0.0061)
-0.4884(0.2737)
青岛市
-0.2688(0.0088)
0.0129(0.8729)
0.995(0.0000)
-0.1096(0.5886)
郑州市
-0.0799(0.4976)
0.0372(0.4513)
1.0665(0.0000)
0.0606(0.5927)
武汉市
-0.0667(0.5236)
0.0364(0.7771)
0.8149(0.0098)
0.0569(0.7172)
长沙市
0.2616(0.4283)
0.1630(0.3495)
0.0170(0.9781)
0.3642(0.5147)
广州市
-0.0830(0.6867)
0.0874(0.2039)
1.1682(0.0000)
0.0881(0.7614)
深圳市
-0.1729(0.1282)
0.1661(0.0047)
0.7648(0.0822)
3.1268(0.0093)
南宁市
-0.1021(0.0028)
0.0288(0.2145)
0.9388(0.0000)
-0.7519(0.0000)
海口市
-0.0403(0.7836)
0.1382(0.2661)
0.7169(0.1688)
0.7477(0.2273)
重庆市
-0.0242(0.9105)
0.3832(0.0542)
0.3603(0.4163)
-0.3382(0.5387)
成都市
-0.3718(0.0000)
0.2990(0.0001)
1.4348(0.0000)
0.0114(0.9770)
贵阳市
-0.0930(0.5891)
0.0146(0.9263)
0.9267(0.0006)
-0.0006(0.9986)
昆明市
0.1253(0.1600)
0.0202(0.7152)
0.5847(0.0395)
0.1880(0.5646)
西安市
0.0150(0.8985)
0.0510(0.8388)
0.6167(0.1307)
-0.3067(0.7809)
兰州市
-0.1730(0.1414)
0.0518(0.3612)
0.9475(0.0000)
-0.2173(0.6663)
西宁市
-0.0557(0.6712)
0.0220(0.7013)
1.0324(0.0000)
0.0832(0.8841)
银川市
-0.3215(0.0175)
0.0650(0.4731)
0.8558(0.0000)
0.6748(0.2695)
乌鲁木齐市
-0.6973(0.0000)
0.2689(0.0011)
0.5608(0.0051)
-0.5309(0.5567)
Table 2.
Estimation results of coefficient of explanatory variables in each city
ln
HVR
系数
ln
LTF
系数
ln
PCDI
系数
ln
PD
系数
模型拟合优度
模型1
0.3336
0.7329
模型2
0.1574
0.2971
0.8528
模型3
-0.0709
0.0783
0.7951
0.9125
模型4
-0.0699
0.0769
0.8015
0.0269
0.9180
Table 3.
Contribution of vacancy rate and control variables to housing price fluctuation
城市划分
一线城市
二线发达城市
二线中等发达城市
二线发展较弱城市
三线城市
ln
HVR
系数均值
-0.2013
-0.2441
-0.0794
-0.0529
-0.2192
ln
LTF
系数均值
0.1771
0.1742
0.1006
0.1151
0.0866
ln
PCDI
系数均值
0.5701
1.1446
0.6013
1.1827
0.8645
ln
PD
系数均值
2.1326
0.4552
-0.3296
-0.0715
0.1622
Table 4.
Mean value of regression coefficients of each explanatory variable by city class
Abstract
Get PDF(in Chinese)
Figures&Tables (6)
Equations (9)
References (36)
Get Citation
Copy Citation Text
Jie WANG, Jiliang ZHANG.
The influence of vacancy rate on housing price: Based on panel data of 35 key cities
[J]. Resources Science, 2020, 42(6): 1135
Download Citation
EndNote(RIS)
BibTex
Plain Text
Tools
Share
Save the article for my favorites
Paper Information
Special Issue:
Received: Aug. 23, 2019
Accepted: --
Published Online: Jun. 25, 2020
The Author Email: ZHANG Jiliang (zhangjlgs@163.com)
DOI:
10.18402/resci.2020.06.11
Recommended Topics
Resource Economy
Research Articles
Set citation alerts for the article
Please enter your email address
Cancel
Confirm