Carbon fiber (CF)/pyrolytic graphite (PG) composites are promising structural materials for molten salt reactors because of their superior performance. Due to the minor density difference between CF and PG, existing methods are impractical for efficient three-dimensional characterization of CF/PG composites. Therefore, in this study, a method based on in-line phase-contrast X-ray microtomography was developed to solve the aforementioned problem. Experimental results demonstrate that the method is suitable for comprehensive characterization of CF/PG composites. The relationship between the microporous defects and fiber orientations of such composites was also elucidated. The findings can be useful for improving the manufacturing process of CF/PG composites.
The molten salt reactor (MSR) is among six alternatives for Gen IV reactors due to its excellent performance in terms of safety and thermal economization. However, structural materials face significant challenges under extreme environments, such as those involving high temperature, high neutron doses, and corrosive coolant[1]. Carbon fiber (CF)-reinforced pyrolytic graphite (PG) composites are a promising choice for structural materials of core barrels and controlling rod guiding tubes in an MSR, because such composites have high thermal shock resistance and suitable mechanical properties, as well as a low density[2,3]. Macrostructural defects are known to be correlated with the braid type and orientation of fiber bundles in three-dimensional (3D) braided carbon–carbon (C/C) composites[4]. However, micro defects, such as pore network and misorientation within a single fiber bundle, remain poorly characterized due to the lack of a suitable approach for detailed analysis of densely distributed CFs in a PG matrix.
X-ray microtomography (XMCT) is widely used because of its non-invasiveness and 3D imaging capability and is employed for characterizing C-based composites other than CF/PG composites[5,6]. However, two main problems must be surmounted for XMCT to be utilized for characterizing CF/PG composites. First, since the diameter of CF is only 6 µm and the inter-fiber spacing is usually less than 1 µm, a sub-micron spatial resolution is required for distinguishing individual fibers. Second, compared with other matrices, such as SiC ()[7], epoxy resin ()[8], and polyamide-6 )[9], the density of the PG ranges from 2.0 to [10], which is much closer to that of CF ()[11]. Therefore, a high-density resolution is also needed to establish sufficient contrast between CF and PG in slices.
Two approaches have been developed and used for CF/PG composite imaging[6]. First, a complete refraction index reconstruction method called holotomography was introduced by Coindreau et al. This method involves performing several (3 or 4) times of classic computed tomography (CT) at different sample-to-detector distances, which provides better refraction indices and density resolutions[12]. Reconstructed slices exhibit significant contrast between the fibers and matrices while maintaining fine spatial resolutions. However, performing multiple CT is time-consuming and involves significant problems in aligning projections at different distances. Thus, this technique is unsuitable for in situ studies. The other approach is the use of the edge-detection mode of in-line phase-contrast microtomography (PCMT), which is associated with image recognition and segmentation algorithms[13,14]. In this method, the detectors are moved away from samples appropriately, while ensuring that the edge-enhancement effect between the fibers and matrices is sufficiently strong to clearly depict boundaries in the slices. However, the deterioration in spatial resolution associated with the large sample-to-detector distance produces severe boundary extensions; hence, this approach is suitable only for sparsely arrayed fibers. In summary, the existing characterization methods lack concurrent simplicity, high-density resolution, and high spatial resolution.
Sign up for Chinese Optics Letters TOC. Get the latest issue of Chinese Optics Letters delivered right to you!Sign up now
To address these issues, in this study, we propose a method based on in-line PCMT with a single projection set for efficiently analyzing fiber reinforced C/C composites.
2. Methods
For materials characterized by weak absorption, such as C-based materials, the spatial resolution and contrast of the in-line PCMT are closely associated with the distinctive edge enhancement obtained using this method. Generally, two locations, , where the intensity reaches its maximum and minimum values ( and , respectively), can be found. These positions correspond to the centers of the “positive” and “negative” Fresnel fringes near the geometric edge. Consequently, the achievable spatial resolution is defined as , while the contrast of the in-line edge enhancement is . The detailed expressions provided by Gureyev[15] are summarized as follows:where is the minimal Fresnel number; is the sample-to-detector distance; is the wavelength of the X ray; and , with as the standard deviation of the detector point spread function (PSF) and representing the sharpness of the geometric edge. These two parameters were determined to be as follows: µ and µ; details of the calculations are provided in Supplementary Materials. is the maximum phase shift associated with the object thickness and the refraction index difference between the two sides of an edge.
Evidently, Eqs. (1) and (2) are monotonically decreasing functions of the minimal Fresnel number or are monotonically increasing functions of the distance . This indicates that a compromise exists between the spatial resolution and contrast. The value at which the spatial resolution and contrast are balanced is known as the best imaging distance for the conventional in-line PCMT[16,17]. Therefore, in the edge-detection mode, spatial resolution is sacrificed for contrast due to the low caused by the small difference in the refraction index between CF and PG.
However, for composites with densely distributed fibers, the spatial resolution decrease renders the gap between the fibers invisible. Assuming that the gaps greater than 1 µm require distinction, the spatial resolution must be lower than 1 µm. According to Eq. (1), should exceed 1.43 or must be less than 10.96 mm. At this distance, the contrast decreases to , which is less than one-third of the theoretical maximum value . Therefore, the most difficult task is increasing the contrast between the CF and PG while maintaining a small sample-to-detector distance.
According to the complex reflective indices between materials and X rays, , where and are the refraction index and the absorption index, respectively, and is about 2000 times more sensitive to the density variance than (for CF, and , while for PG, and at 15 keV)[18]. Precise retrieval of requires at least two sample-to-detector distances, and [19]. However, it is infeasible and impractical to realize in the small range below 10.96 mm. Therefore, the single distance phase-retrieval process with a phase-attenuation duality Paganin algorithm was employed for retrieving the phase shift in projections[20]. The Paganin algorithm is expressed as follows:where is the projection at the rotation angle for a sample-to-detector distance ; is the corresponding phase-retrieved projection; is the ratio of and ; and and are the spatial frequencies in the Fourier space corresponding to a point () in real space. Notably, the spatial resolution of is guaranteed by Eq. (1) if is sufficiently small. After retrieving all phase projections from 0 to 180°, a 3D refractive index distribution is reconstructed by applying the standard-filtered back-projection algorithm to as follows:Where denotes a one-dimensional (1D) convolution, and is the CT reconstruction filter. Since is more sensitive than , the contrast between CF and PG in slices is increased.
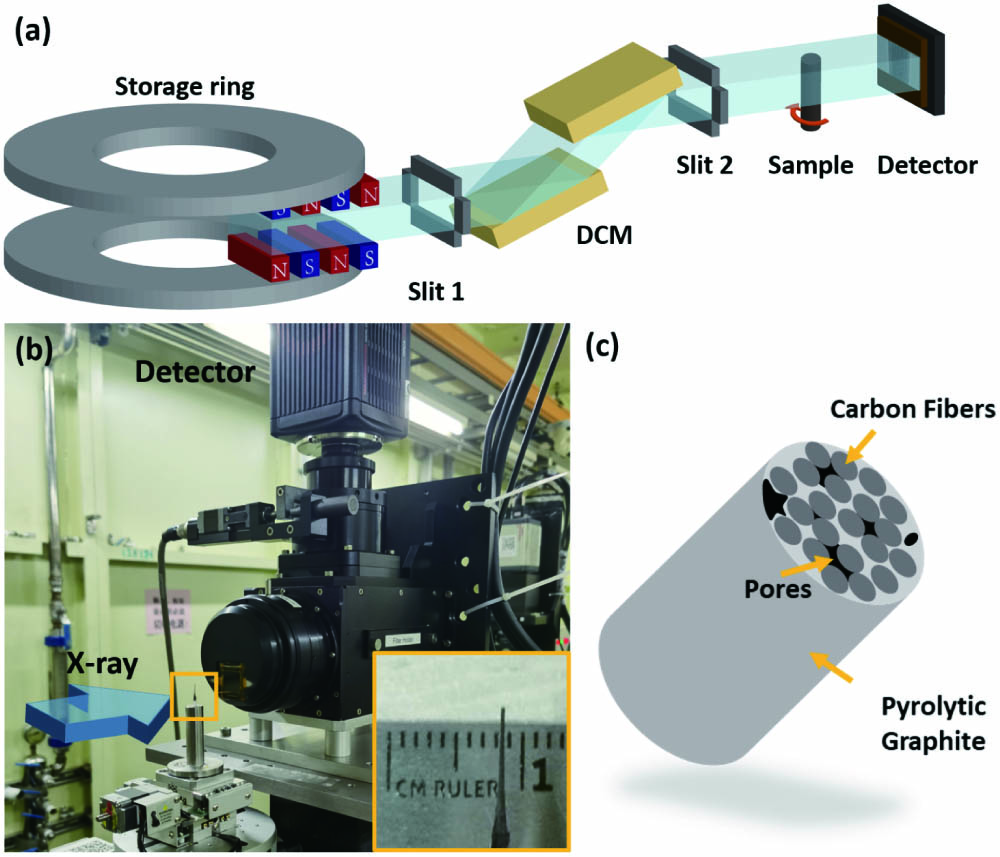
In-line PCMT setup: the validation experiment was conducted using the BL13W1 X-ray imaging beamline[21,22] at the Shanghai Synchrotron Radiation Facility (SSRF), a 3.5 GeV third-generation synchrotron radiation facility. Compared to the laboratory X-ray tube sources, the synchrotron-based X ray has great advantages with a much higher flux density[23,24]. As shown in Fig. 1(a), a white beam of X rays was generated by a wiggler, an insertion device of the storage ring, and then monochromatized by a double-crystal monochromator, whose ΔE/E is better than [25]. The size of the X-ray beam was 45 mm (horizontal) (vertical) at 20 keV, extending 30 m downstream of the light source. The experimental setup is illustrated in Fig. 1(b). The detector used for data acquisition was an X-ray conversion system comprised of a scintillation crystal (LuAG:Ce with a 100 µm thickness), an optical microscope manufactured by Optique Peter (model: MICRX016), and a complementary metal–oxide–semiconductor (CMOS) detector manufactured by HAMAMATSU (model: ORCA-Flash 4.0 C11440). The basic pixel size of the CMOS detector was 6.5 µm, but, after optical magnification, the effective pixel size became 0.325 µm. The photon energy used for the in-line PCMT was 15 keV, considering the weak absorption of C materials. In total, 1080 projections were collected over the 180° of rotation, with the exposure time of a projection being set as 1.5 s as a compromise between image quality and time consumption.
Figure 1.Experimental setup for in-line PCMT: (a) schematic diagram of optical path in the BL13W1 of the SSRF; (b) photograph of experimental setup in the BL13W1 of the SSRF; (c) components of CF/PG composite sample.
CF/PG composite preparation: CFs (T700, Φ6 µm from TORAY, Japan) were immersed in pitch under hot isostatic pressing to produce prepregs, followed by carbonization in a furnace at 1000°C. The immersion and carbonization processes were repeated several times to improve the density of the prepregs. The fully carbonized prepregs were then graphitized at 2100–2800°C to convert the pyrolytic C to graphite. A diagrammatic illustration of the CF/PG composite is shown in Fig. 1(c).
Data processing: projections were collected at sample-to-detector distances of 10, 40, and 100 mm, corresponding to values of 1.57, 0.39, and 0.16, respectively. The phases of the projections were retrieved using the Paganin algorithm, and the slice reconstruction process was performed using PITRE software, which was developed by our group and is available for free download[26]. The commercial software Avizo was used for the 3D visualization and quantitative analyses.
Slice optimization: the slices reconstructed from the projections at 10, 40, and 100 mm are displayed in Figs. 2(a)–2(c). According to Eqs. (1) and (2), the corresponding theoretical spatial resolution () values are 0.98, 1.65, and 2.64 µm, while the theoretical contrast values are , , and , respectively. Overall, the edge-enhancement effect significantly improves the contrast with increasing . However, considering the section marked by the deep blue square, which contains densely distributed fibers, the deterioration in spatial resolution makes the gaps between the fibers indiscernible. To enhance the quantitative comparison, the profiles of three lines incorporating five fibers were extracted and are shown in Fig. 2(d), with the black arrows and dashed lines denoting the fiber boundaries. Clearly, at a low sample-to-detector distance, the spatial details are well-preserved, with a narrow grayscale variation of five, which is barely distinguishable. After is increased to 40 and 100 mm, the grayscale difference is magnified about . However, the broader boundaries from the better edge enhancement compress the limited gaps, causing the second and fourth peaks in Fig. 2(d) to vanish. This demonstrates the unresolvable conflict between the spatial resolution and contrast in the edge-detection mode of in-line PCMT.
Figure 2.Quality optimization for (a)–(c) slices reconstructed from in-line projections at sample-to-detector distances of 10, 40, and 100 mm, (d) profiles of the lines marked in (a)–(c), (e)–(g) slices reconstructed from phase-retrieved projections at sample-to-detector distances of 10, 40, and 100 mm, and (h) profiles of the lines marked in (e)–(g).
The slices reconstructed from the phase-retrieved projections using the Paganin algorithm at the three distances are shown in Figs. 2(e)–2(g). Compared with Figs. 2(a)–2(c), Figs. 2(e)–2(g) exhibit better contrast and visibility in terms of the components. Considering identical sections in Figs. 2(a)–2(c), the fibers are easily distinguished even when extremely close, along with the tiny pores represented by the dark dots in the slices. As seen from the line profiles of Figs. 2(e)–2(g) in Fig. 2(h), the slice at 10 mm exhibits the highest contrast while retaining the sharp edges of the fibers. However, when the distance increases to 100 mm, the peaks and troughs flatten, owing to deterioration of the spatial resolution . The flatness of the curve obscures the boundaries of the fibers, which makes it difficult to render their separation from the matrix via single thresholding of the grayscale value. Therefore, in-line PCMT at a small sample-to-detector distance of 10 mm combined with the Paganin algorithm-based phase-retrieval process is validated as an effective method for 3D imaging of CF/PG composites that provides high spatial and density resolutions. Based on the segmentation of accurate 3D reconstruction data, quantitative analyses of fibers and pores are also conducted.
Fiber analysis: CFs exhibit high mechanical strength anisotropy and polarity. Therefore, the abnormal orientation and tortuosity of fibers under a load may induce a major shear force and even failure[27]. Previous studies have focused on fiber bundles because of the problems associated with characterizing the density and spatial resolution of CF/PG composites[3,28]. However, in this study, all fibers could be identified and labeled, even in dense arrays, and morphologically analyzed. The statistics of the orientation and tortuosity of 502 fibers extracted from a section are shown in Fig. 3. First, the polar angle reflects the deviation of the fibers from the load direction. According to the data in Fig. 3(b), 89.4% of the fibers are concentrated within a range of 1.5°, which highlights the consistency and excellent mechanical strength of the composite in the load direction. Based on the spatial distribution of the fibers in Fig. 3(a) and Visualization 1, fibers with larger values are scattered, while those with smaller values are associated with high density. This demonstrates that a high consistency of the fibers reduces pores and bulk graphite, thereby increasing the mechanical strength of the composite. The azimuthal angle is another parameter that is critical for distinguishing sub-aggregations in a bundle of fibers. As depicted in Fig. 3(c) and Visualization 2, a sandwich structure is evident due to differences, with interlayer boundaries marked by the white dashed line. In addition, the histogram in Fig. 3(d) shows that the values of the two outer layers are around 245°, whereas that of the inner layer gradually changes from 70° to 112°. This indicates a fine degree of parallelism for fibers of the same layer, contrary to those of different layers. Finally, the tortuosity of each fiber was calculated using its curvature length and straight length . In Fig. 3(e) and Visualization 3, fibers with low tortuosity values are primarily observed to be densely distributed (deep blue fibers), while those with high values are observed to be relatively farther apart because twisted fibers create more spacing. According to the data in Fig. 3(f), the average tortuosity of the fibers is 1.00047, with a standard deviation of , which validates the collimation of this bundle of fibers. Thus, the fibers in this bundle are highly consistent, although sub-aggregations still exist, which reflects the preference of the three main azimuthal angles.
Figure 3.Images and plots for the statistical analyses of fibers in the CF/PG composite, with (a) and (b) displaying the spatial distribution and histogram for the polar angle of each fiber, (c) and (d) exhibiting the spatial distribution and histogram of the azimuthal angle of each fiber, and (e) and (f) showing the spatial distribution and histogram of the tortuosity value of each fiber.
Pore network analysis: the pores in the CF/PG composite include connected and isolated varieties. The connected pores are likely problematic because larger voids reduce the mechanical strength of the composite and provide infiltration routes for molten salt, which aggravates corrosion[29]. In contrast, the isolated pores are disconnected, which means that their volumes are not measurable via mercury intrusion porosimetry[30]; therefore, these pores represent a source of porosity measurement errors. However, in our method, these two types of pores could be analyzed simultaneously. Considering that the theoretical spatial resolution is about 0.98 µm, pores whose diameters are above 1.0 µm are taken into account. In Fig. 4(a), the connected pores are marked in white, while the isolated pores are highlighted in blue. Detailed volume rendering of these pores is presented in Visualization 4. From the histograms in Figs. 4(b) and 4(c), the average equivalent radius of the isolated pores is determined to be 1.5 µm, while that of the connected pores is up to 7.8 µm. Furthermore, although the isolated pores account for about 97.7% of the detected pores, their volume amounts to only 39.7% of the void fraction, with the few connected pores accounting for the remaining 60.3%.
Figure 4.Volumetric and positional analyses of pores in the CF/PG composite showing (a) spatial distribution of connected and isolated pores, (b) histogram of the equivalent radius of isolated pores, (c) histogram of the equivalent radius of connected pores, and (d)–(f) spatial distributions of connected pores and the azimuthal angle of their neighboring fibers.
To investigate the formation mechanism of the connected pores, the data of these pores were incorporated into the spatial distribution of the fibers. Typical results obtained via geometric analysis of the fibers are displayed in Figs. 4(d)–4(f). Although the morphologies of the pores differ, their extension directions are consistent with the orientation of the fibers. However, the azimuthal angles of the fibers on the left and right of the pores are different; this suggests that the connected pores form between groups of fibers with discordant holistic orientations. At the macroscale, connected pores are observed primarily in the joint portion of different bundles of fibers in 3D braided composites under insufficient immersing of the precursor[30]. The present study provides a rare opportunity for observing this phenomenon at the microscale, even though the environment involves a bundle of fibers exhibiting fine consistency. This observation is likely explained by the superior parallelism and lower interspacing of fibers sharing the same azimuthal angle. This spontaneous association of fibers enlarges the gaps between the sub-aggregations, creating space for the microbubbles to produce a connected pore network.
4. Conclusion
In conclusion, CF/PG composites are promising structural materials for the MSRs for their superior performance in many aspects. However, due to the dense distribution of fibers and low density difference between CF and PG, existing 3D characterization methods lack concurrent simplicity, high-density resolution, and high spatial resolution. In this study, a new method was proposed for efficiently characterizing CF/PG composites. We combined in-line PCMT in the near Fresnel region with the phase-attenuation duality Paganin algorithm. This ensured a high-density resolution while maintaining an excellent spatial resolution. Geometric analyses of the fibers proved that fibers in the analyzed bundle were highly consistent, although sub-aggregations persisted, which reflected a preference for the three main azimuthal angles. Furthermore, connected pores tended to form easily between these sub-aggregations, despite the small difference in spacing angle between the sub-aggregations.