• NUCLEAR TECHNIQUES
  • Vol. 46, Issue 7, 070606 (2023)
Pengcheng GAO1、2, Bin ZHANG2、*, Hao YANG2, and Jianqiang SHAN2
Author Affiliations
  • 1Naval Research Institute, Beijing 100071, China
  • 2School of Nuclear Science and Technology, Xi'an Jiaotong University, Xi'an 710049, China
  • show less
    DOI: 10.11889/j.0253-3219.2023.hjs.46.070606 Cite this Article
    Pengcheng GAO, Bin ZHANG, Hao YANG, Jianqiang SHAN. Development of flow blockage model for core heat transfer and its application in QUENCH experiment[J]. NUCLEAR TECHNIQUES, 2023, 46(7): 070606 Copy Citation Text show less
    Illustration of fuel claddings after a LOCA simulation during a PHEBUS-LOCA experiment
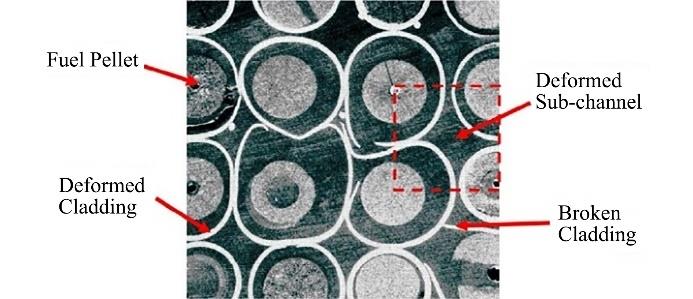
    Fig. 1. Illustration of fuel claddings after a LOCA simulation during a PHEBUS-LOCA experiment
    Heat and mass transfer phenomena during LOCA with ballooning of fuel claddings
    Fig. 2. Heat and mass transfer phenomena during LOCA with ballooning of fuel claddings
    Flow chart of ISAA-FRTMB coupling interface
    Fig. 3. Flow chart of ISAA-FRTMB coupling interface
    Illustration of flow blockage model (a) The top view of the fuel assembly, (b) The front view of the fuel assembly
    Fig. 4. Illustration of flow blockage model (a) The top view of the fuel assembly, (b) The front view of the fuel assembly
    Diagram of QUENCH test facility
    Fig. 5. Diagram of QUENCH test facility
    Diagram of test bundle cross-section
    Fig. 6. Diagram of test bundle cross-section
    Sketch map of node division of QUENCH experimental device
    Fig. 7. Sketch map of node division of QUENCH experimental device
    Bundle heating power and steam flow ratio
    Fig. 8. Bundle heating power and steam flow ratio
    Cladding temperature variation at axial elevations of 950 mm, 750 mm, 550 mm, and 450 mm
    Fig. 9. Cladding temperature variation at axial elevations of 950 mm, 750 mm, 550 mm, and 450 mm
    Channel blockage rate at 950 mm axial elevation
    Fig. 10. Channel blockage rate at 950 mm axial elevation
    Blockage rate of coolant channel at different radial rings
    Fig. 11. Blockage rate of coolant channel at different radial rings
    Comparison of experimental and simulated values of cladding hoop strain and temperature for rod #4
    Fig. 12. Comparison of experimental and simulated values of cladding hoop strain and temperature for rod #4
    Cladding hoop strain at 950 mm axial elevation
    Fig. 13. Cladding hoop strain at 950 mm axial elevation
    Internal pressure values of test rods
    Fig. 14. Internal pressure values of test rods
    阶段Phase时间Time / s事件Event

    0. 预备阶段

    Preparation

    -1 000

    开始记录数据,Tmax = 800 K,电功率为4.62 kW

    Start data recording, Tmax = 800 K, electrical power at 4.62 kW

    I. 加热阶段

    Heating phase

    0以最大电加热功率启动瞬态Start of transient with max electrical power increase rate
    2电功率27 kW Electrical power 27 kW
    186.6

    将电功率转换为3.4 kW,Tmax = 1 317 K,电功率为41 kW

    Switch of the electrical power to decay heat of 3.4 kW, Tmax = 1 317 K, electrical power 41 kW

    II. 冷却阶段

    Cooldown phase

    200

    达到包壳壁面最大温度,Tmax = 1 349 K

    Cladding surface temperature maximum reached, Tmax = 1 349 K

    217.8

    启动快速蒸汽供应管线(50 g·s-1)并接入到蒸汽(2 g·s-1)和氩气(6 g·s-1)缓慢供应管线

    Initiation of rapid steam supply line (50 g·s-1) additionally to slow steam supply (2 g·s-1) and carrier argon (6 g·s-1)

    223⁓225包壳快速冷却至400 K Rapid cladding cooling to 400 K
    237⁓263将棒束温度增加到660 K Increase of bundle temperature to 660 K

    III. 淹没阶段

    Flooding phase

    362

    启动应急冷却水供应,关闭蒸汽供应,将氩气切换到从棒束顶部供应

    Initiation of quench water supply, switch-off of steam supply, switch of argon to bundle top supply

    387达到最大骤冷速率100 g·s-1 Maximum quench rate (100 g·s-1) reached
    480组件完全被水淹没 Bundle completely filled with water
    528关闭加热电源,Tmax = 333 K Electrical power switched off, Tmax = 333 K
    1 100数据记录结束 End of data recording
    Table 1. Events and phases of the QUENCH-L0

    燃料棒编号

    Fuel rod number

    实验值[18]

    Experiment

    耦合系统

    ISAA-FRTMB

    SOCRAT/V3[19]
    Rod #4

    114.6 s at 1 073 K

    (高度 967.8 mm)

    (Elevation 967.8 mm)

    118.81 s at 1 101.49 K

    (高度 950 mm)

    (Elevation 950 mm)

    150.56 s at 1 077.35 K

    (高度 950 mm)

    (Elevation 950 mm)

    Rod #3

    119.2 s at 1 089 K

    (高度 954 mm)

    (Elevation 954 mm)

    119.63 s at 1 112.52 K

    (高度 950 mm)

    (Elevation 950 mm)

    146.52 s at 1 066.36 K

    (高度 950 mm)

    (Elevation 950 mm)

    Rod #11

    167.2 s at 1 141 K

    (高度 957.8 mm)

    (Elevation 957.8 mm)

    169.76 s at 1 115.35 K

    (高度 950 mm)

    (Elevation 950 mm)

    138.43 s at 1 192.68 K

    (高度 950 mm)

    (Elevation 950 mm)

    Table 2. Cladding burst
    Pengcheng GAO, Bin ZHANG, Hao YANG, Jianqiang SHAN. Development of flow blockage model for core heat transfer and its application in QUENCH experiment[J]. NUCLEAR TECHNIQUES, 2023, 46(7): 070606
    Download Citation