• Journal of Geo-information Science
  • Vol. 22, Issue 6, 1282 (2020)
Yajuan ZHOU1、1、2、2, Zhiyuan ZHAO1、1、2、2、3、3、3, Sheng WU1、1、2、2、3、3、3、*, Zhixiang FANG4, and Zuoqi CHEN1、1、2、2、3、3、3
Author Affiliations
  • 1. 福州大学数字中国研究院(福建),福州 350003
  • 1Academy of Digital China ( Fujian ), Fuzhou University, Fuzhou 350003, China
  • 2. 空间数据挖掘与信息共享教育部重点实验室,福州 350003
  • 2Key Laboratory of Spatial Data Mining and Information Sharing, Ministry of Education, Fuzhou 350003, China
  • 3. 海西政务大数据应用协同创新中心,福州 350002
  • 3. 武汉大学测绘遥感信息工程国家重点实验室,武汉 430079
  • 3Fujian Collaborative Innovation Center for Big Data Applications in Governments, Fuzhou 350002, China
  • 4State Key Laboratory of Information Engineering for Surveying, Mapping and Remote Sensing, Wuhan University, Wuhan 430079, China;
  • show less
    DOI: 10.12082/dqxxkx.2020.190623 Cite this Article
    Yajuan ZHOU, Zhiyuan ZHAO, Sheng WU, Zhixiang FANG, Zuoqi CHEN. Estimating the Potential Demand for Bicycle Travel based on Large-scale Mobile Phone Location Data[J]. Journal of Geo-information Science, 2020, 22(6): 1282 Copy Citation Text show less
    The method for estimating potential bicycle travel demand based on mobile phone location data
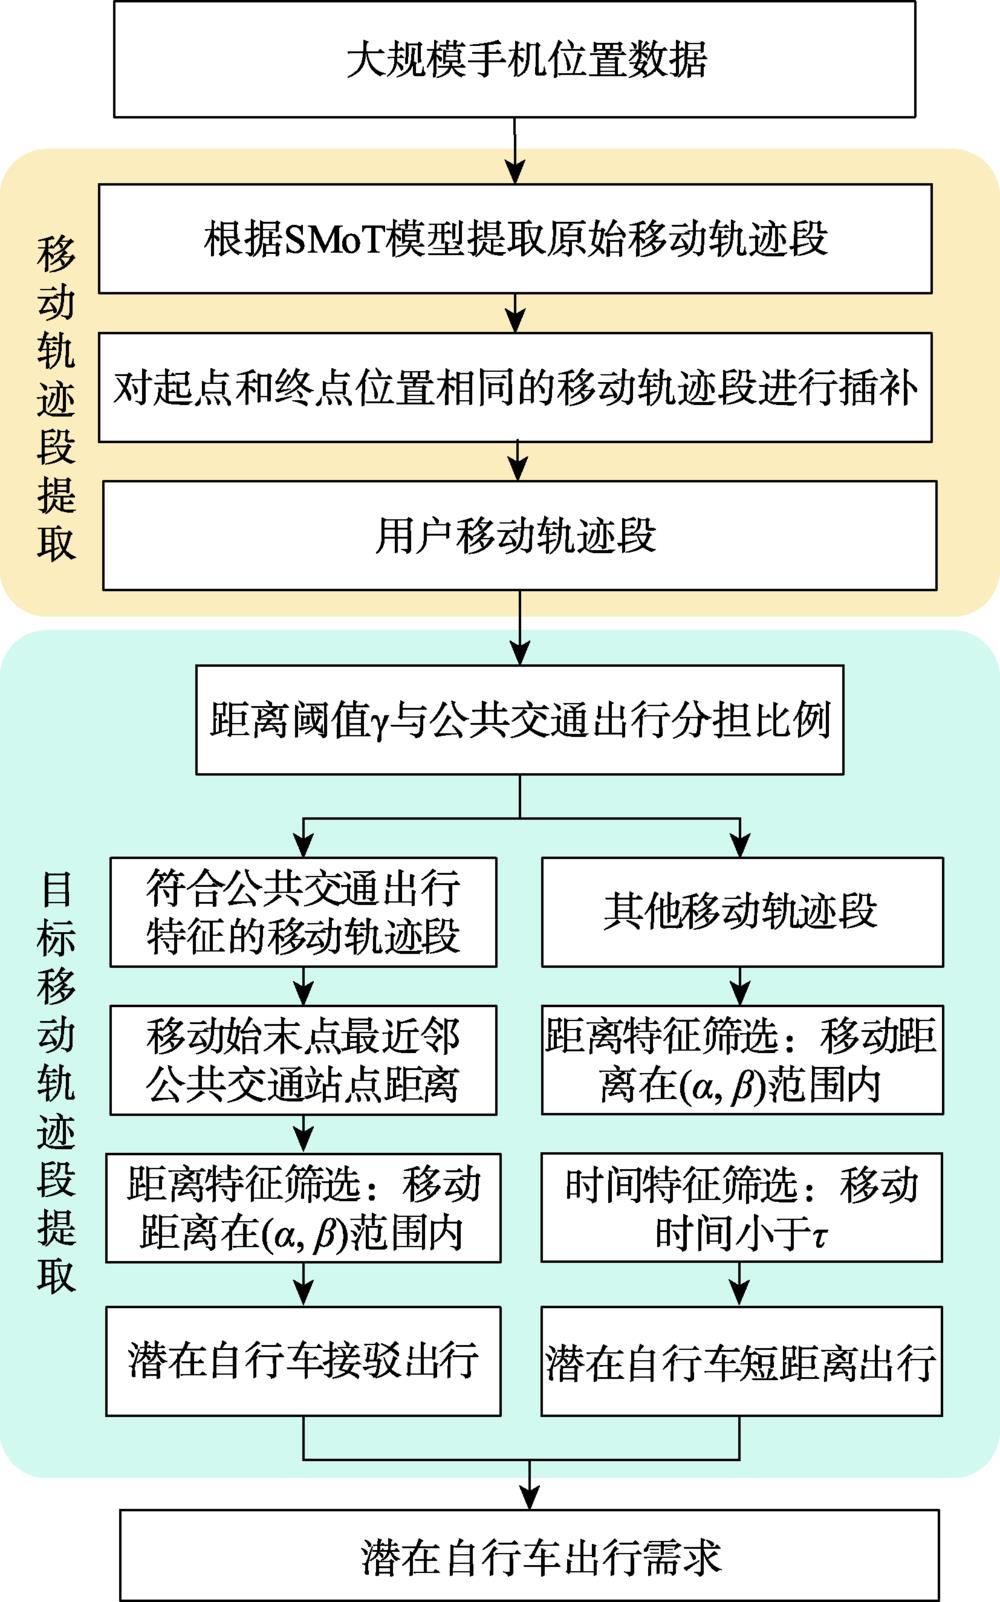
    Fig. 1. The method for estimating potential bicycle travel demand based on mobile phone location data
    The principle of stop identification
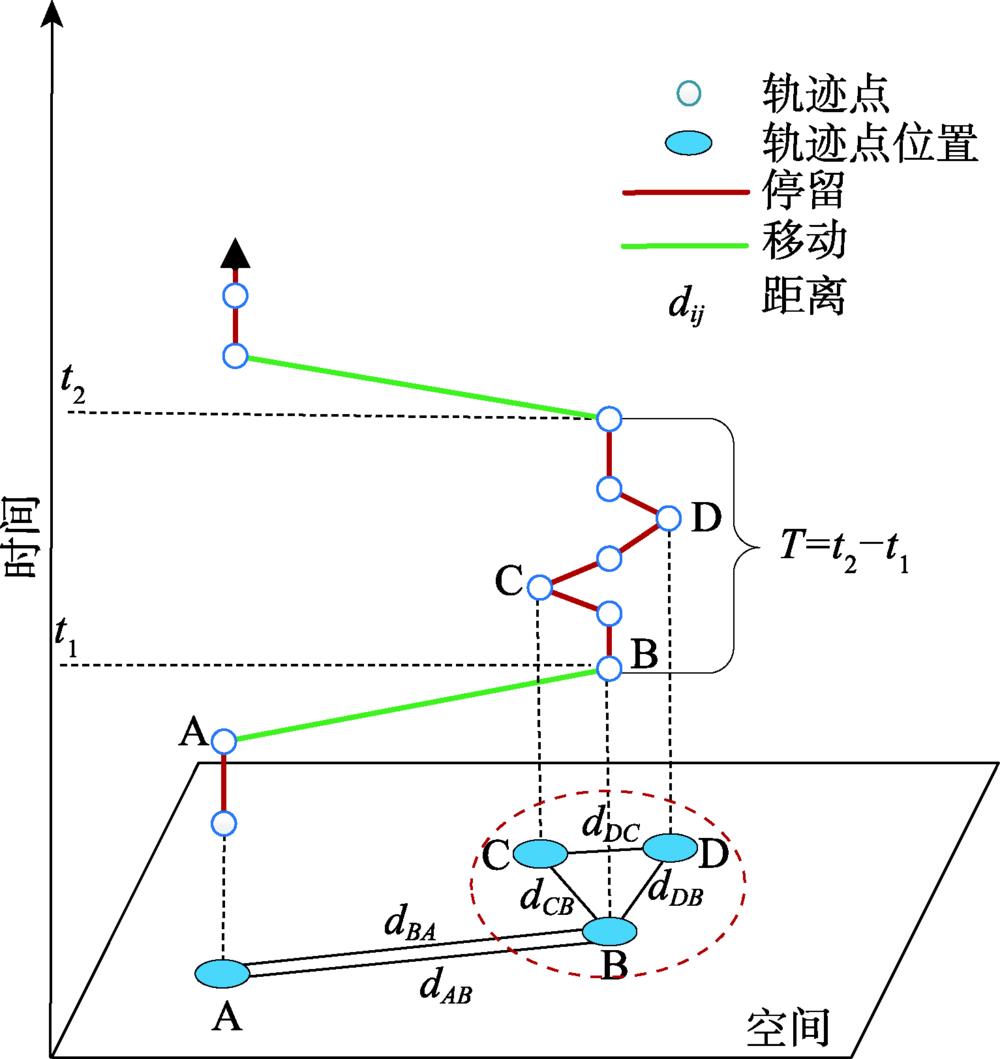
    Fig. 2. The principle of stop identification
    The interpolation of move trajectory segment with same start and end point by the furthest point
    Fig. 3. The interpolation of move trajectory segment with same start and end point by the furthest point
    Shanghai's administrative districts
    Fig. 4. Shanghai's administrative districts
    The density distribution of the base stations in the research dataset in 2012
    Fig. 5. The density distribution of the base stations in the research dataset in 2012
    The probability distribution of the coverage radius of the base stations in the research dataset in 2012
    Fig. 6. The probability distribution of the coverage radius of the base stations in the research dataset in 2012
    The mobile phone location data sampling time interval distribution
    Fig. 7. The mobile phone location data sampling time interval distribution
    The distribution of the Shanghai public transportation stations in Shanghai in 2017
    Fig. 8. The distribution of the Shanghai public transportation stations in Shanghai in 2017
    The spatial distribution for mobile phone user travel OD extracted in the research dataset in 2012
    Fig. 9. The spatial distribution for mobile phone user travel OD extracted in the research dataset in 2012
    Thespatial distribution for potential cycling and parking demand in Shanghai
    Fig. 10. Thespatial distribution for potential cycling and parking demand in Shanghai
    The spatial distribution for potential cycling and parking demand in Shanghai during some periods of time
    Fig. 11. The spatial distribution for potential cycling and parking demand in Shanghai during some periods of time
    The temporal characteristics of potential bicycle travel demand in Shanghai in 2012
    Fig. 12. The temporal characteristics of potential bicycle travel demand in Shanghai in 2012
    Thetemporal characteristics of potential bicycle travel demand in some areas of Shanghai in 2012
    Fig. 13. Thetemporal characteristics of potential bicycle travel demand in some areas of Shanghai in 2012
    The temporal characteristics of public transportation transfer travel demand in Shanghai
    Fig. 14. The temporal characteristics of public transportation transfer travel demand in Shanghai
    The spatial distribution of the top 10 public transportation stations with the highest transfer travel demand
    Fig. 15. The spatial distribution of the top 10 public transportation stations with the highest transfer travel demand
    The temporal characteristics of public transportation transfer travel demand for partial public transportation stations
    Fig. 16. The temporal characteristics of public transportation transfer travel demand for partial public transportation stations
    用户ID时间基站经度/°基站纬度/°类型
    BD9D*****00:34121.***31.***打电话
    BD9D*****02:45121.***31.***收短信
    BD9D*****22:56121.***31.***握手
    BD9D*****23:32121.***31.***关机
    Table 1. Mobile phone location data
    顺序名称区域公交线路
    1潘泾路宝山区宝山90路
    2甪彭路松江区松江76路
    3机场保税区浦东新区机场八线
    4荣乐东路松江区松江10路
    5野朱泾金山区朱枫线
    6老宅嘉定区嘉定63路,嘉定123路
    7沪青平公路青浦区沪商高速专线
    8丰宝路宝山区宝山85路
    9祥凝浜路青浦区朱家角2路
    10春浓路嘉定区嘉定109路
    Table 2. The top 10 public transportation stations with the highest transfer travel demand
    Yajuan ZHOU, Zhiyuan ZHAO, Sheng WU, Zhixiang FANG, Zuoqi CHEN. Estimating the Potential Demand for Bicycle Travel based on Large-scale Mobile Phone Location Data[J]. Journal of Geo-information Science, 2020, 22(6): 1282
    Download Citation