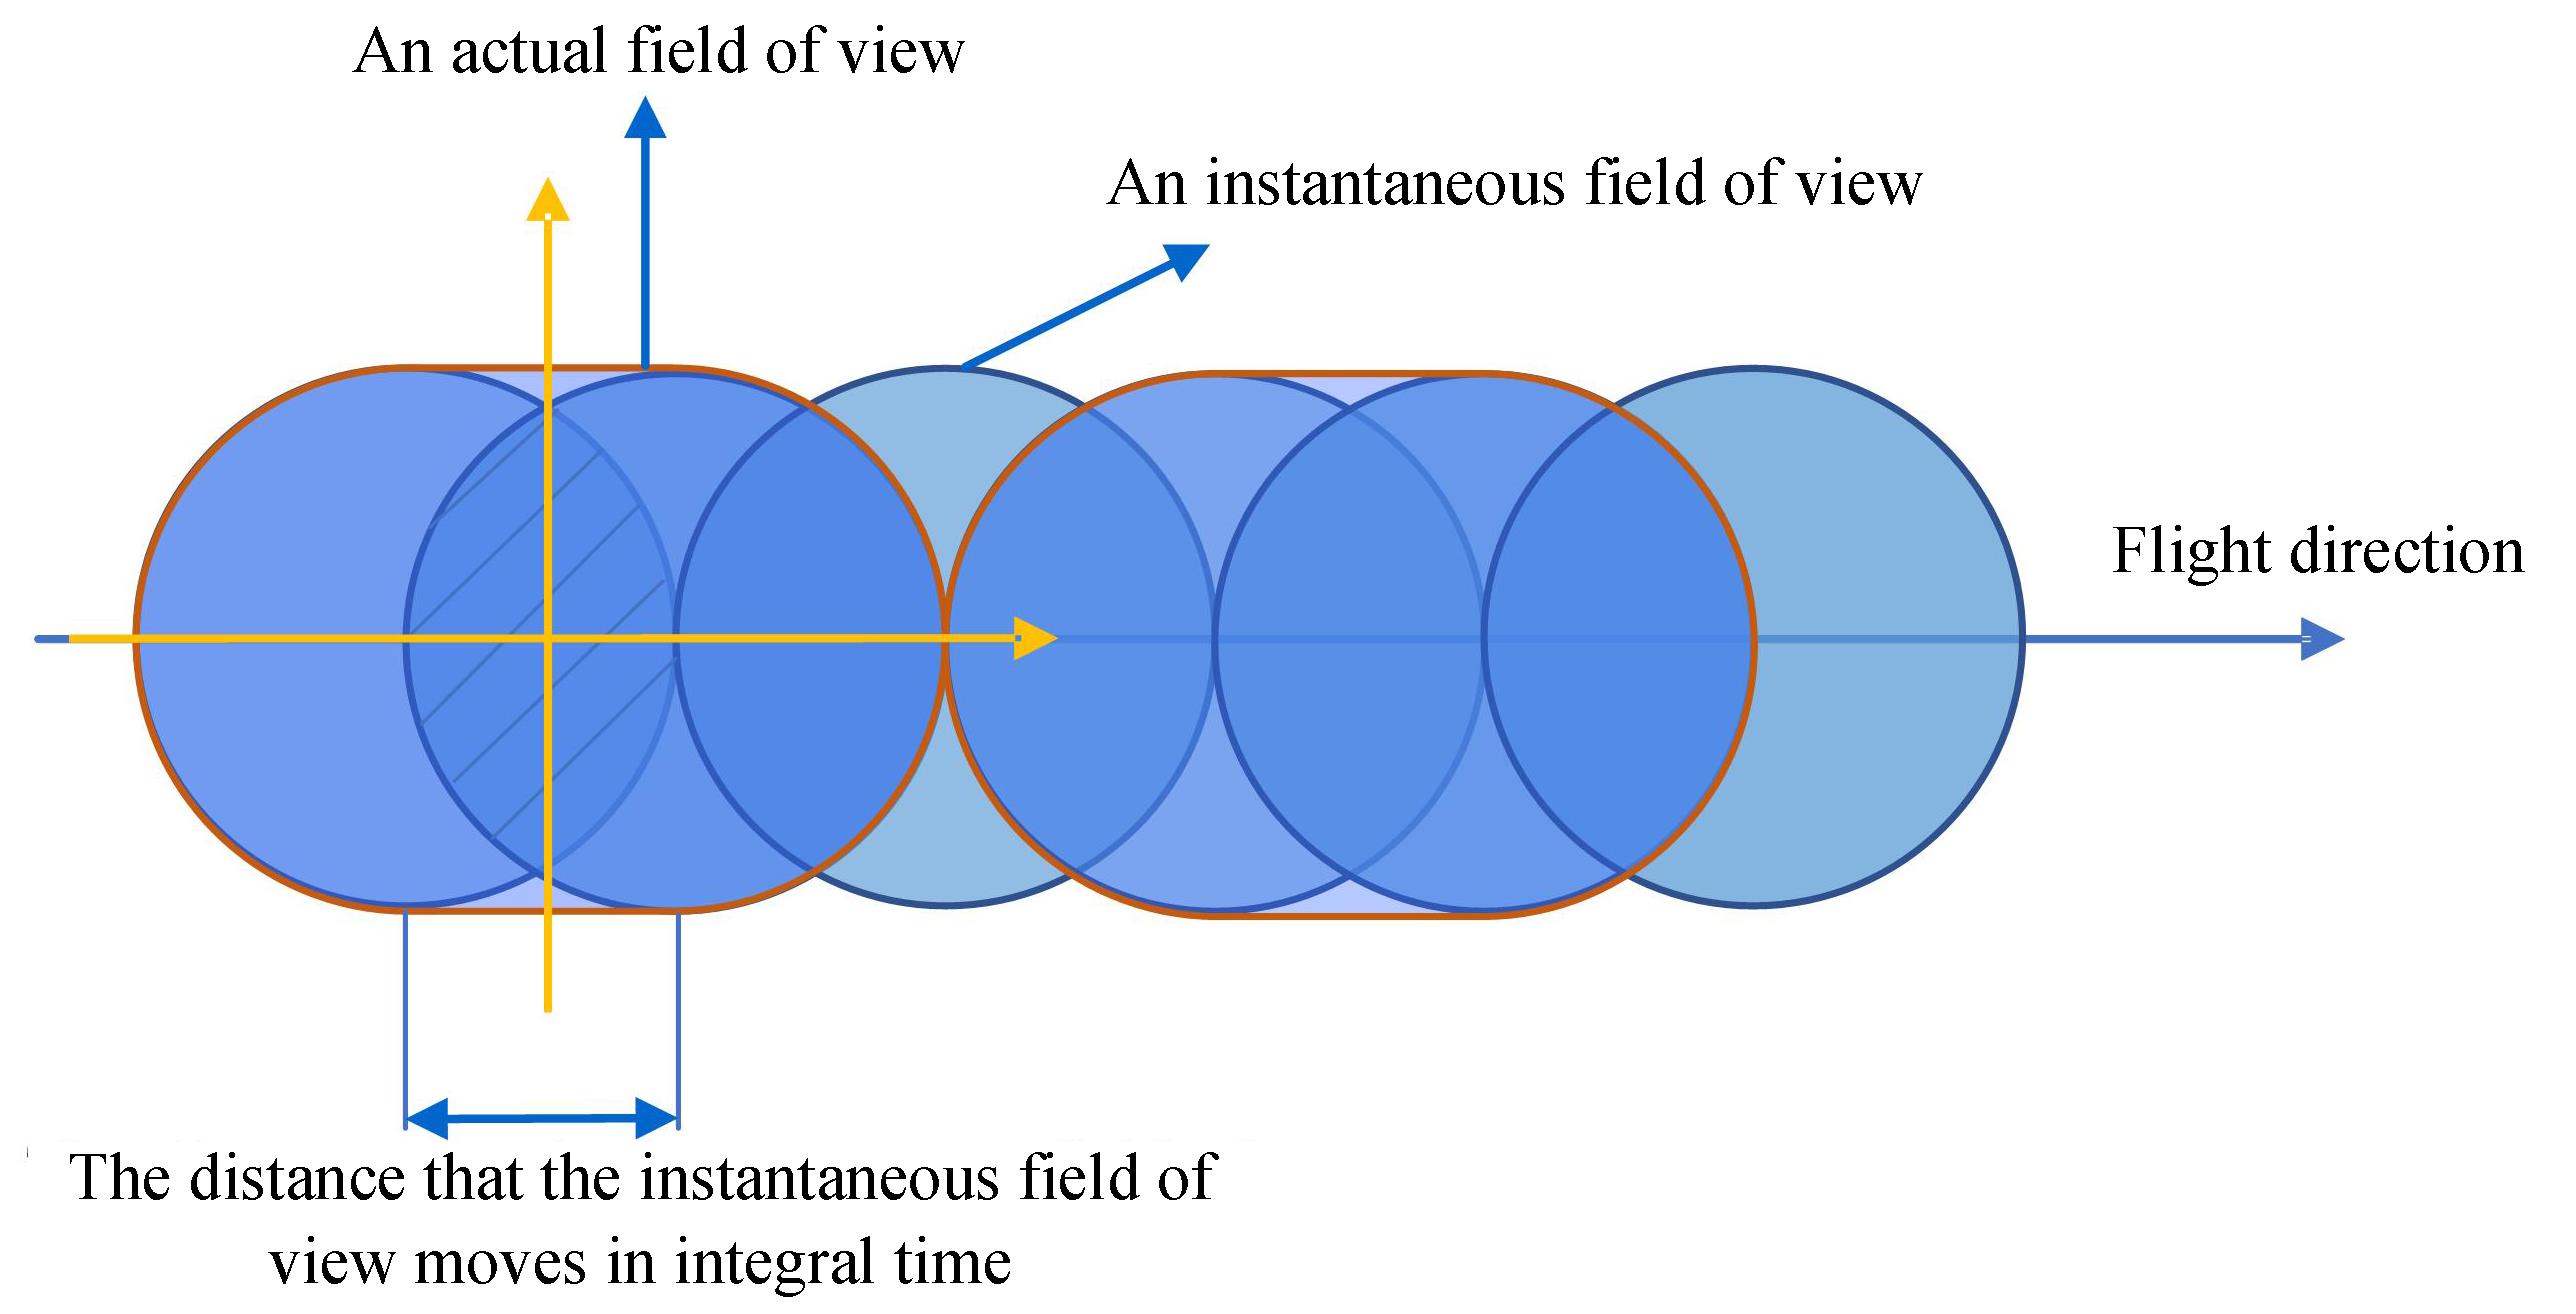
Fig. 1. Schematic diagram of the transient field drag effect of POSP
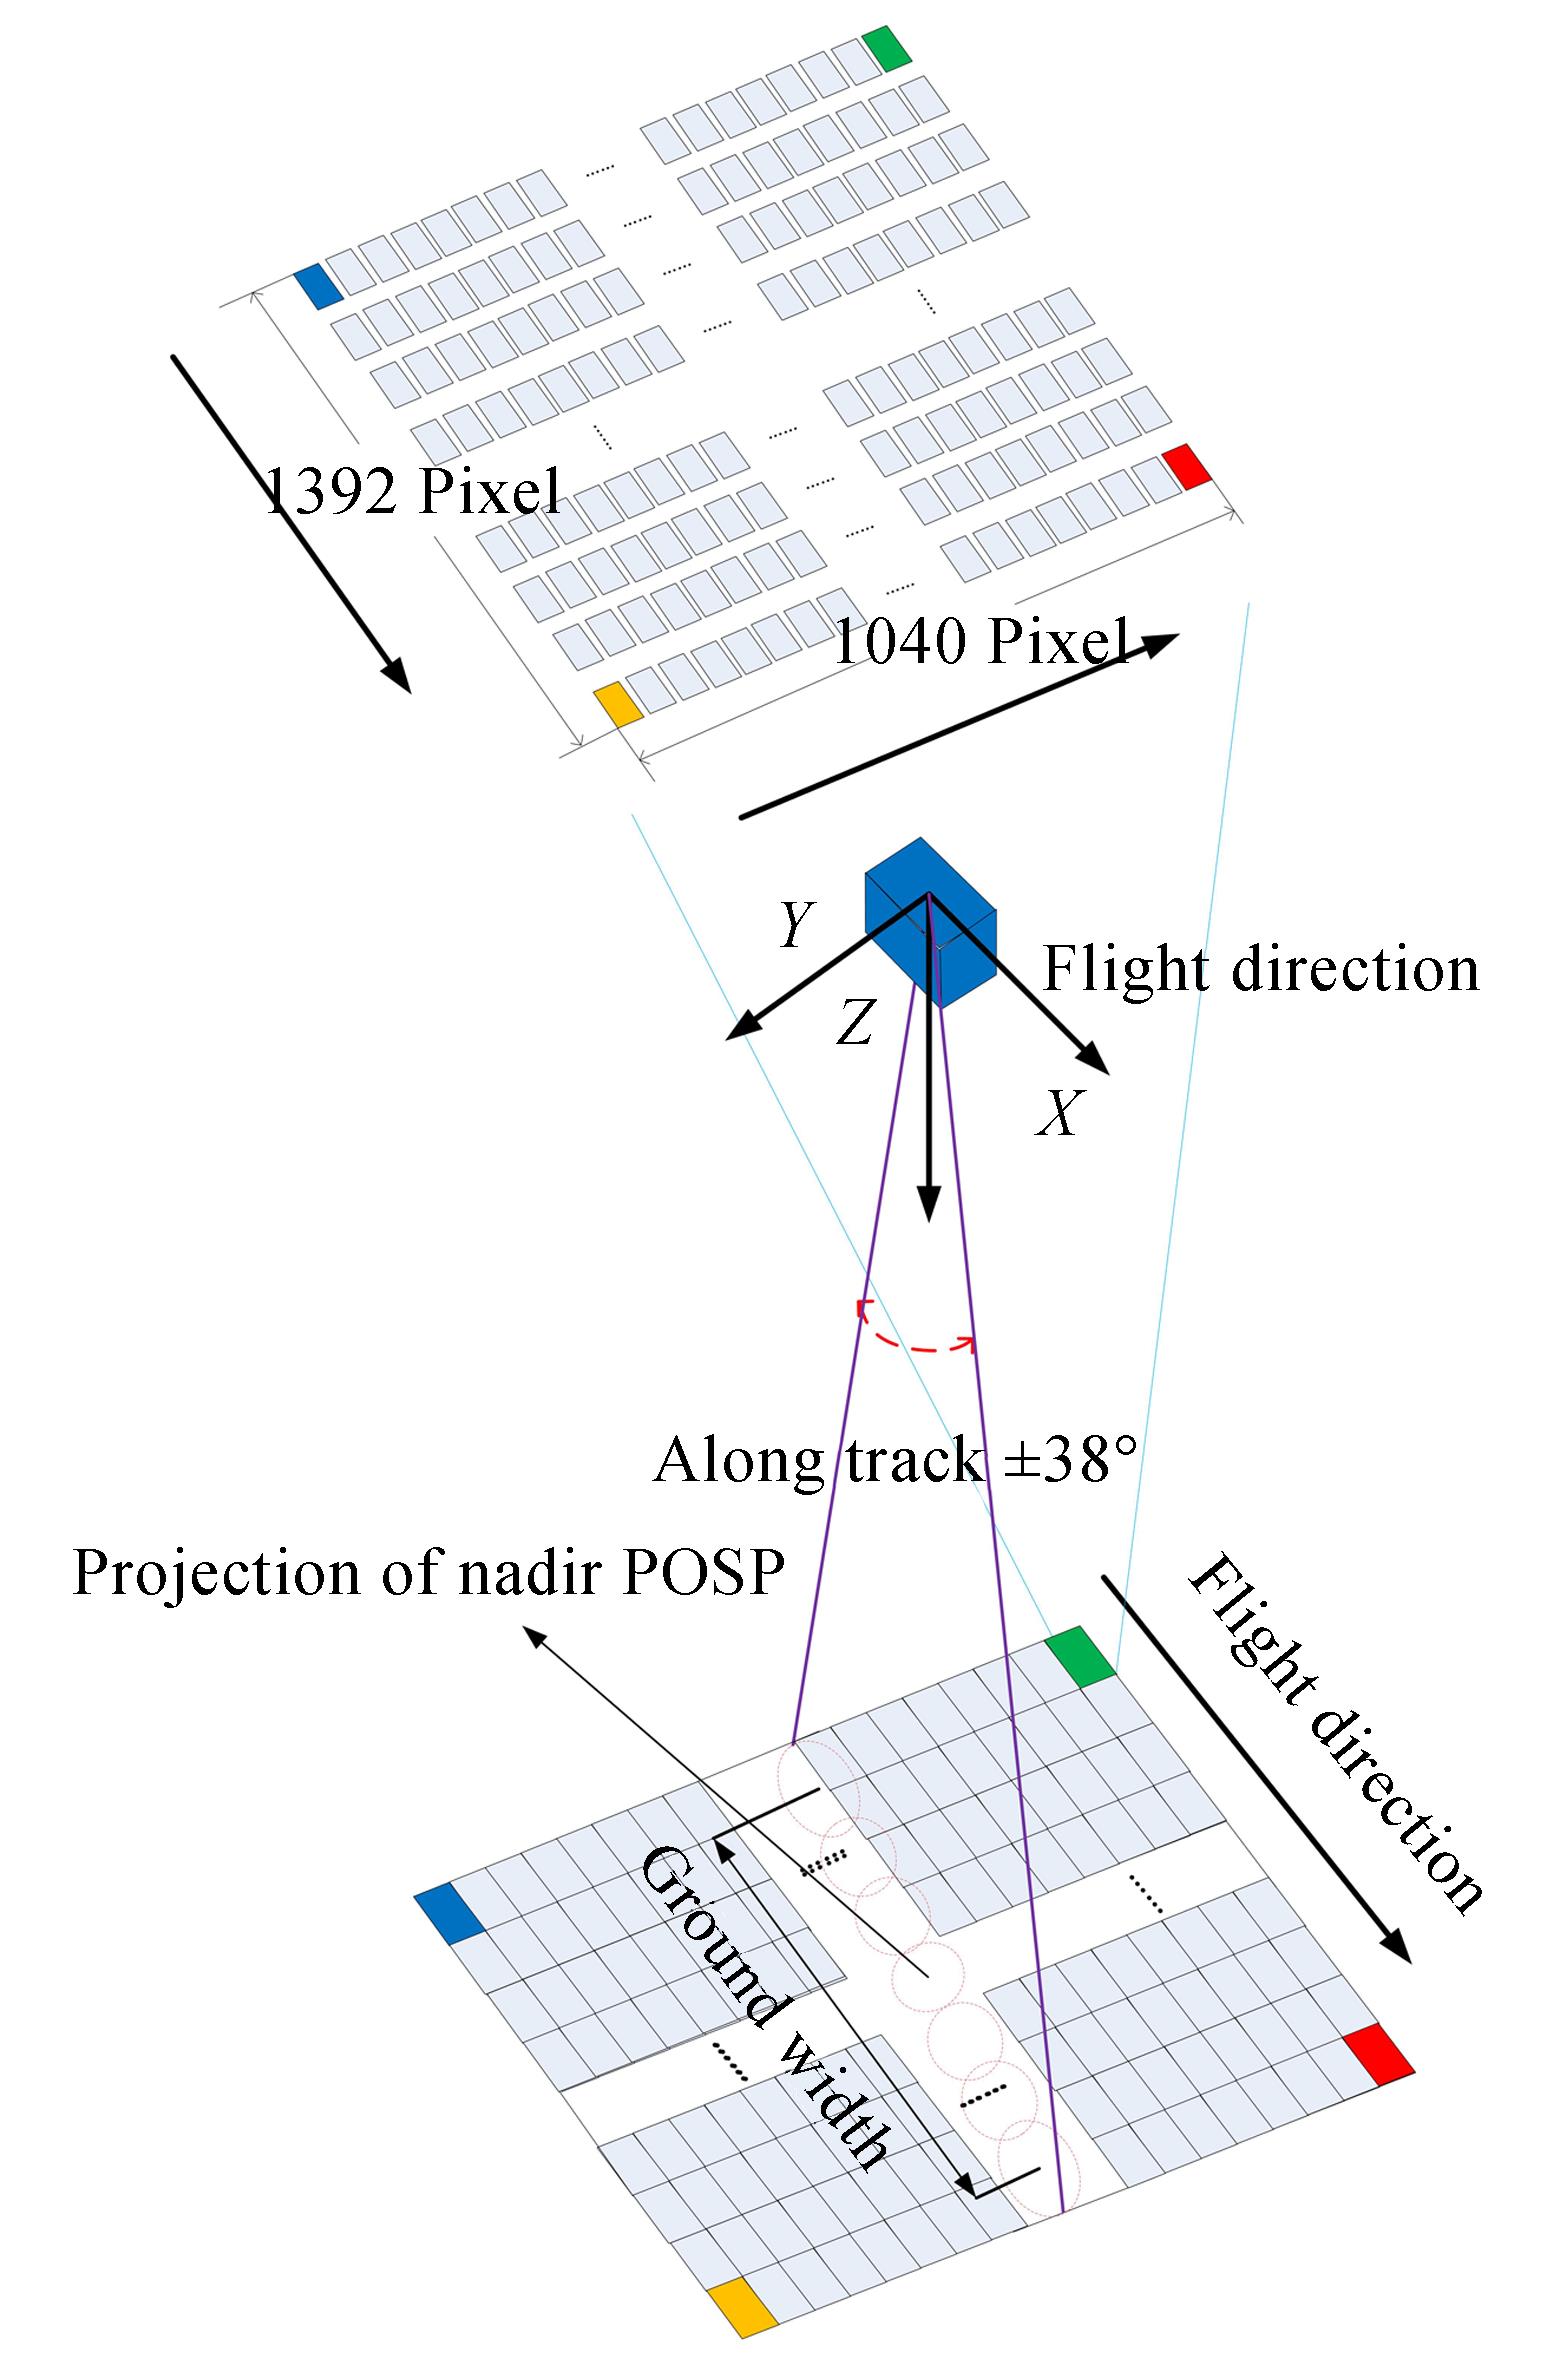
Fig. 2. Field of view matching schematic diagram of POSP and SIPC
Fig. 3. Transformation between coordinate systems
Fig. 4. Schematic diagram of POSP observation vector
Fig. 5. The process of geolocation and correction method for dual polarization instrument on same platform
Fig. 6. Spatial distribution of geolocation
Fig. 7. Scene used in experiment and target points
Fig. 8. POSP geolocation results
Fig. 9. Probability distribution of location error
Fig. 10. Matching results between sea and land edges
Fig. 11. Mosaic of SIPC aerial data
Fig. 12. Data comparison of POSP and SIPC
| Technical indexes | POSP | SIPC |
|---|
| Scanning mode | Along track scanning | Push broom scanning | | Field of view | -38°~+38° | 10°×7.4° | | Nadir pixel spatial resolution | φ42 m@4 km | 0.5 m@4 km | | Instantaneous field of view | 0.602° | - | | Scanning mirror pointing accuracy | <3' | - | | Resolution | - | 1392(H)×1040(V) | | Sampling interval | 0.52° | - | | Sampling period | 1.43 ms/frame | 500 ms/frame | | Radiation accuracy | 5% | 5% | | Polarization accuracy | <0.005(@P=0.2) | <0.02(@P=0.2) |
|
Table 1. Technical indexes of POSP and SIPC
| Coordinate system | Origin | X-axis direction |
|---|
| Image space coordinate | Projection center | Parallel to the image plane coordinate system x-axis | | Instrument coordinate | Projection center | Point to the right side of the vector | | IMU body coordinate | Instrument center of mass | Point to the right side of the vector | | Navigation coordinate | Carrier center | Consistent with geography heading east | | Earth-centered, Earth-fixed(ECEF) | Geocentric | Point to the intersection of the zero meridian plane and the protocol |
|
Table 2. Coordinate system definitions
| Name | Symbols | Nominal value | Error |
|---|
| Instrument geodetic longitude | | 120° | 0.000 1° | | Instrumental geodetic latitude | | 40° | 0.000 1° | | Instrument geodetic height | | 5 000 | 5 | | Pitch angle | | 0° | 0.008° | | Roll angle | | 45° | 0.008° | | Yaw angle | | 0° | 0.07° | | SIPC principal point | | 2.98 | 1 | | SIPC principal point | | 2.74 | 1 | | SIPC focal length | | 51.70 | 5 | | Position elevation | | 200 | 5 | | Installation error angle (pitch) | | 0° | 0.1° | | Installation error angle (roll) | | 0° | 0.1° | | Installation error angle (Yaw) | | 0° | 0.1° | | POSP scan angle | | -38°~+38° | 0.05° |
|
Table 3. Geolocation simulation verifies the data used
| Result of geolocation results | Nominal value | SIPC | POSP |
|---|
| Calculated value | Error(standard deviation) | Calculated value | Error(standard deviation) |
|---|
| Geolocation error | | | | | Longitude | 120° | 119.938 0° | 0.000 206° | 119.986 6° | 0.000 196° | | Latitude | 40° | 40.006 2° | 0.000 104° | 40.003 4° | 0.000 211° | | Height | 5 000 m | 200.021 0 m | 4.627 1 m | 200.213 7 m | 5.432 3 m |
|
Table 4. Geolocation results of SIPC and POSP
| Target | Average | Standard deciation |
|---|
| T1 | T2 | T3 | T4 | T5 | T6 |
|---|
| Scene 1 | 25.07 | 26.26 | 28.56 | 25.52 | 30.19 | 27.35 | 27.16 | 4.36 | | Scene 1 improved | 23.92 | 24.62 | 25.18 | 21.73 | 24.13 | 25.24 | 24.14 | 2.89 | | Scene 2 | 27.63 | 23.50 | 24.05 | 24.82 | 26.81 | 28.29 | 25.85 | 4.46 | | Scene 2 improved | 23.71 | 20.35 | 22.05 | 23.65 | 24.54 | 22.68 | 22.83 | 3.33 |
|
Table 5. Location results of SIPC aviation test