• Chinese Journal of Lasers
  • Vol. 50, Issue 10, 1001003 (2023)
Yuanqi He1,2 and Jianqiang Zhu1,*
Author Affiliations
  • 1Key Laboratory of High Power Laser and Physics, Shanghai Institute of Optics and Fine Mechanics, Chinese Academy of Sciences, Shanghai 201800, China
  • 2Center of Materials Science and Optoelectronics Engineering, University of Chinese Academy of Sciences, Beijing 100049, China
  • show less
    DOI: 10.3788/CJL220947 Cite this Article Set citation alerts
    Yuanqi He, Jianqiang Zhu. Study on Structural Stability of Long Cantilever Target Assembly in High Power Laser Facility[J]. Chinese Journal of Lasers, 2023, 50(10): 1001003 Copy Citation Text show less
    Structural diagram of NIF cryogenic target assembly
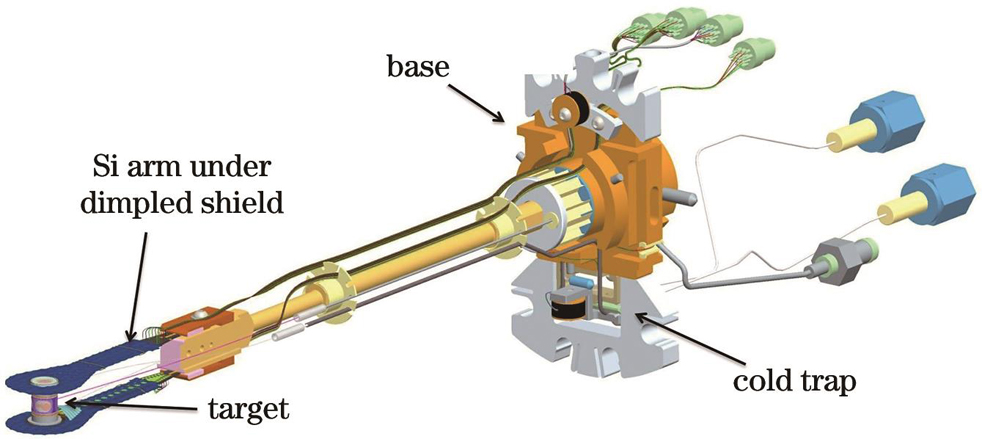
    Fig. 1. Structural diagram of NIF cryogenic target assembly
    Preliminary design of damping target assembly. (a) Assembly drawing; (b) scheme 1; (c) scheme 2
    Fig. 2. Preliminary design of damping target assembly. (a) Assembly drawing; (b) scheme 1; (c) scheme 2
    Continuous beam model with spring damping support
    Fig. 3. Continuous beam model with spring damping support
    Schematic of damping structure
    Fig. 4. Schematic of damping structure
    Schematics of arrangement of vibration damping components. (a) 3-Y type; (b) 3-inverted Y type; (c) 4-X type
    Fig. 5. Schematics of arrangement of vibration damping components. (a) 3-Y type; (b) 3-inverted Y type; (c) 4-X type
    Contour diagrams for simulation results of wires. (a) Suspension response deformation; (b)natural frequency; (c) wire mass
    Fig. 6. Contour diagrams for simulation results of wires. (a) Suspension response deformation; (b)natural frequency; (c) wire mass
    Response deformation of suspension end versus diameter
    Fig. 7. Response deformation of suspension end versus diameter
    Simulation results when wire diameter is 0.8 mm . (a) Natural frequency; (b) static deformation
    Fig. 8. Simulation results when wire diameter is 0.8 mm . (a) Natural frequency; (b) static deformation
    Final structure of damping target assembly
    Fig. 9. Final structure of damping target assembly
    PSD displacement of test bench under vibration source 1
    Fig. 10. PSD displacement of test bench under vibration source 1
    Layout of test bench
    Fig. 11. Layout of test bench
    Measurement results under vibration source 1. (a) Time domain result of original target assembly; (b) frequency domain result of original target assembly; (c) time domain result in scheme 1 when wire diameter is 1.2 mm; (d) frequency domain result in scheme 1 when wire diameter is 1.2 mm
    Fig. 12. Measurement results under vibration source 1. (a) Time domain result of original target assembly; (b) frequency domain result of original target assembly; (c) time domain result in scheme 1 when wire diameter is 1.2 mm; (d) frequency domain result in scheme 1 when wire diameter is 1.2 mm
    Measurement results under vibration source 2. (a) Time domain result of original target assembly; (b) frequency domain result of original target assembly; (c) time domain result in scheme 1 when wire diameter is 1.2 mm; (d) frequency domain result in scheme 1 when wire diameter is 1.2 mm
    Fig. 13. Measurement results under vibration source 2. (a) Time domain result of original target assembly; (b) frequency domain result of original target assembly; (c) time domain result in scheme 1 when wire diameter is 1.2 mm; (d) frequency domain result in scheme 1 when wire diameter is 1.2 mm
    Measurement results in scheme 2 when wire diameter is 1.2 mm. (a) Vibration source 1, time domain; (b) vibration source 1, frequency domain; (c) vibration source 2, time domain; (d) vibration source 2, frequency domain
    Fig. 14. Measurement results in scheme 2 when wire diameter is 1.2 mm. (a) Vibration source 1, time domain; (b) vibration source 1, frequency domain; (c) vibration source 2, time domain; (d) vibration source 2, frequency domain
    Frequency /Hz13457920-100
    PSD displacement /(mHz-121.0×10-61.4×10-64.0×10-64.0×10-68.0×10-75.0×10-78.0×10-8
    Table 1. Parameters of refrigerator operating vibration source
    ProjectSection sizeLengthMaterial
    Baseϕ40 mm24 mmPure copper
    Copper platenϕ4 mm124.5 mmPure copper
    Copper clamp6 mm×8 mm22 mmPure copper
    Si arm6 mm×1 mm63.5 mmSi
    Thermal sleeveϕ6 mm7 mmAu and Al
    Table 2. Main structure parameters of target assembly
    Type of vibration damping componentFirst natural frequency /HzSecond natural frequency /Hz
    Original target assembly without vibration damping component57.357.9
    3-Y type88.290.5
    3-inverted Y type88.290.5
    4-X type91.494.0
    Table 3. Natural frequencies of different damping target assemblies
    Global damping coefficientMaximum response deformation of suspension end /(10-3 mm)Convergence time /sOptimization efficiency /%
    0.015.622.73-
    0.026.362.0325.6
    0.035.991.6838.5
    0.045.751.4945.4
    0.056.091.2853.1
    Table 4. Simulation results under variable global damping
    Target assemblyNatural frequency /HzResponse deformation under vibration source 1 /mResponse deformation optimization rate /%Convergence time under vibration source 2 /sConvergence time optimization rate /%
    Original target assembly579.64×10-5-2.86-
    Target assembly with wire diameter of 0.8 mm1386.36×10-693.42.0528.3
    Target assembly with wire diameter of 1.0 mm1537.68×10-692.02.1126.2
    Target assembly with wire diameter of 1.2 mm1634.20×10-695.62.0926.9
    Table 5. Comparison of vibration response characteristics between original target assembly and target assembly in scheme 1
    Target assemblyNatural frequency /HzResponse deformation in vibration source 1 /mResponse deformation optimization rate /%Convergence time under vibration source 2 /sConvergence time optimization rate /%
    Original target assembly57.39.64×10-5-2.86-
    Target assembly with wire diameter of 0.8 mm138.06.09×10-693.71.2855.2
    Target assembly with wire diameter of 1.0 mm153.09.89×10-689.71.2655.9
    Target assembly with wire diameter of 1.2 mm163.05.54×10-694.31.2855.2
    Table 6. Comparison of vibration response characteristics between original target assembly and target assembly in scheme 2
    Target assemblyVibration source 1Convergence time under vibration source 2 /sNatural frequency /Hz
    Root mean square value of deformation /mResponse frequency /Hz
    Original target assembly1.67×10-5343.3233.8
    Target assembly with wire diameter of 0.8 mm1.37×10-6110, 1852.45113.0
    Target assembly with wire diameter of 1.0 mm1.71×10-6130, 2161.24120.0
    Target assembly with wire diameter of 1.2 mm1.04×10-699, 1801.13178.0
    Table 7. Measurement results of target assembly in scheme 1 and original target assembly
    Target assemblyVibration source 1Convergence time under vibration source 2 /sNatural frequency /Hz
    Root mean square value of deformation /mResponse frequency /Hz
    Original target assembly1.67×10-5343.3233.8
    Target assembly with wire diameter of 0.8 mm3.26×10-6109, 1851.25110.7
    Target assembly with wire diameter of 1.2 mm1.38×10-6110, 1860.76183.0
    Table 8. Measurement results of target assembly in scheme 2 and original target assembly
    Yuanqi He, Jianqiang Zhu. Study on Structural Stability of Long Cantilever Target Assembly in High Power Laser Facility[J]. Chinese Journal of Lasers, 2023, 50(10): 1001003
    Download Citation