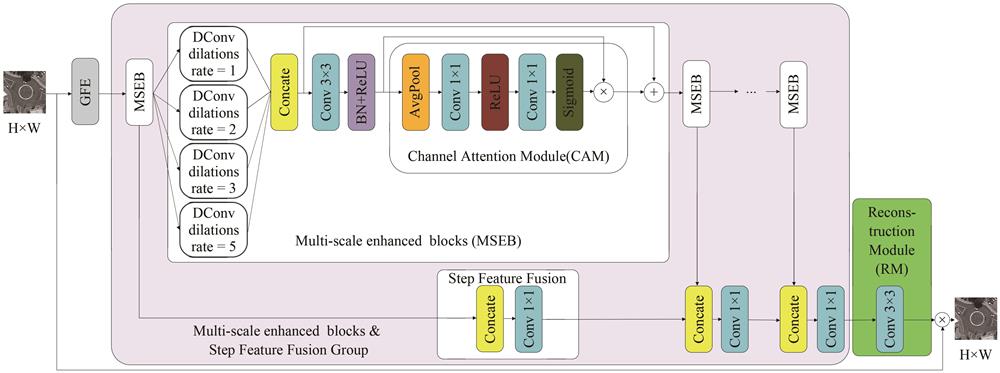
Fig. 1. MRFENet structure diagram
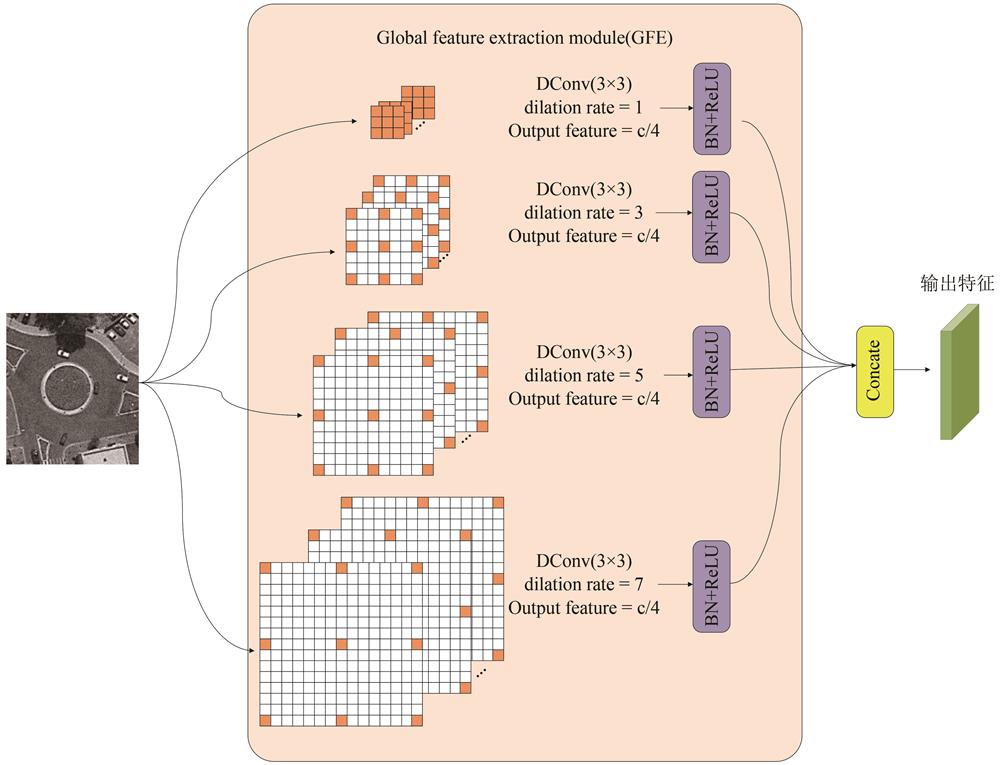
Fig. 2. Structure diagram of global feature extraction module
Fig. 3. Examples of NWPU-RESISC45 dataset
Fig. 4. Example of different noise intensity datasets
Fig. 5. Example of RSSCN7 datasets and real noise datasets
Fig. 6. Performance curves under different parameters
Fig. 7. Loss curve chart
Fig. 8. Example of denoising results of different algorithms(
=15)
Fig. 9. Example of denoising results of different algorithms(σ=20)
Fig. 10. Example of denoising results of different algorithms(σ=35)
Fig. 11. Example of denoising results of different algorithms(σ=50)
Fig. 12. Denoising results of various methods under different noise intensity
Fig. 13. Example of real noise denoising result
Dataset | Methods | PSNR(dB)/SSIM σ2 = 15 | PSNR(dB)/SSIM σ2 = 20 | PSNR(dB)/SSIM σ2 = 35 | PSNR(dB)/SSIM σ2 = 50 | PSNR(dB)/SSIM Hybrid noise |
---|
NWPU-RESISC45 | NLM | 29.315/0.863 7 | 25.469/0.811 7 | 22.187/0.723 1 | 20.142/0.625 7 | 24.012/0.752 3 | BM3D | 29.588/0.878 0 | 26.352/0.832 5 | 24.732/0.769 5 | 22.025/0.710 5 | 25.131/0.793 1 | DnCNN | 30.732/0.924 1 | 28.565/0.850 3 | 27.182/0.833 7 | 25.149/0.789 7 | 27.973/0.839 0 | RIDNet | 30.893/0.924 5 | 29.438/0.875 1 | 27.679/0.841 5 | 25.493/0.796 3 | 28.512/0.852 6 | REDJ | 31.096/0.925 6 | 30.635/0.891 7 | 28.031/0.849 9 | 25.592/0.805 1 | 29.467/0.885 2 | MRFENet(ours) | 31.478/0.944 7 | 30.833/0.894 5 | 28.622/0.854 7 | 26.036/0.812 7 | 29.499/0.890 3 | RSSCN7 | NLM | 28.078/0.879 8 | 25.377/0.789 5 | 24.165/0.721 5 | 20.575/0.601 9 | 24.537/0.761 7 | BM3D | 28.842/0.886 8 | 26.174/0.812 4 | 24.691/0.760 3 | 21.362/0.673 5 | 25.882/0.790 1 | DnCNN | 31.949/0.929 7 | 28.051/0.843 7 | 26.322/0.839 2 | 25.033/0.819 3 | 27.256/0.840 3 | RIDNet | 32.340/0.943 4 | 28.866/0.889 3 | 28.149/0.847 2 | 25.474/0.822 9 | 28.481/0.867 4 | REDJ | 32.290/0.950 8 | 29.472/0.891 0 | 28.228/0.858 3 | 26.163/0.830 5 | 29.022/0.877 1 | MRFENet(ours) | 32.434/0.958 7 | 29.636/0.892 6 | 28.386/0.862 7 | 26.635/0.849 8 | 29.255/0.832 5 |
|
Table 1. Quantitative results of different noise intensities under each method
Dataset | Evaluation | Noisy | NLM | BM3D | DnCNN | RIDNet | REDJ | MRFENet(ours) |
---|
Washington DC mall | NIQE↓ | 7.978 7 | 8.439 3 | 9.595 1 | 9.405 6 | 10.329 4 | 12.738 5 | 8.138 5 | BRISQUE↓ | 43.804 8 | 50.605 8 | 43.456 3 | 43.457 8 | 43.455 5 | 43.458 4 | 42.458 2 | PIQE↓ | 39.366 0 | 83.656 4 | 48.993 3 | 38.598 6 | 40.470 7 | 45.659 7 | 37.056 6 |
|
Table 2. Quantitative results of real noise images under each method
Module | GFE | CAM | Step feature fusion | PSNR(dB)/SSIM |
---|
Experiment | √ | × | × | 28.563/0.870 2 | × | √ | × | 28.427/0.863 7 | × | × | √ | 28.556/0.869 3 | √ | √ | × | 29.355/0.881 4 | √ | × | √ | 29.165/0.873 7 | × | √ | √ | 29.545/0.882 1 | √ | √ | √ | 29.636/0.892 6 |
|
Table 3. Quantitative results of ablation experiments