
Fang Erxi, Zou Wei, Hu Danfeng, Wang Jiajun. Fluorescence Molecular Tomography Reconstruction Algorithm Based on Volume Compensation[J]. Chinese Journal of Lasers, 2018, 45(3): 307016
- Chinese Journal of Lasers
- Vol. 45, Issue 3, 307016 (2018)
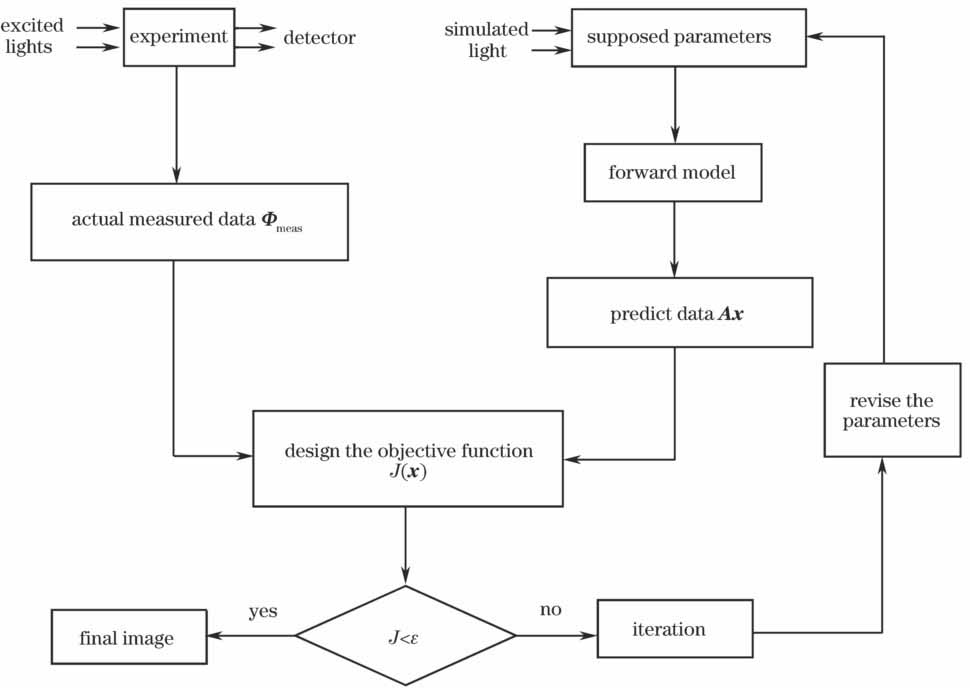
Fig. 1. Flow chart of FMT reconstruction algorithm
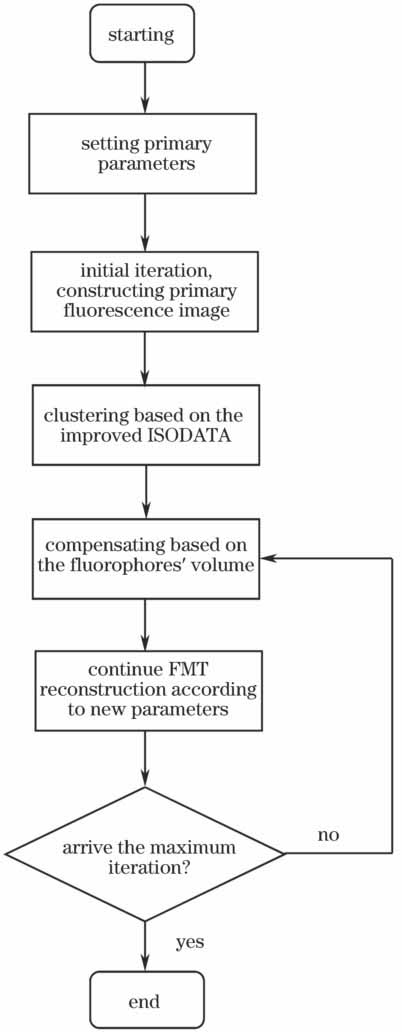
Fig. 2. Flow diagram of FMT reconstruction algorithm based on volume compensation
Fig. 3. Image reconstruction of double target phantom. (a) Double target phantom; (b) triangular mesh for FEM
Fig. 4. Convergence performance of different clustering algorithm in terms of the cluster uniformity JC
Fig. 5. Convergence performance of different clustering algorithm in terms of the cluster uniformity Jb
Fig. 6. Reconstructed results for double target phantom. Reconstructed results (a) before and (b) after volume compensation
Fig. 7. Reconstruction images before and after the volume compensation when adding Gaussian noises of (a) RSN=40 dB, (b) RSN =30 dB, and (c) RSN =20 dB
Fig. 8. Reconstruction results of triple target phantom. (a) Triple targets phantom; (b) mesh for FEM; reconstructed results (c) before and (d) after volume compensation
|
Table 1. Optical parameters of forward model
|
Table 2. Quantitative evaluation of different methods for double target phantom (iterate 60 times)
|
Table 3. Quantitative evaluation of different methods for three target phantom (iterate 60 times)

Set citation alerts for the article
Please enter your email address
© Copyright 2018-2021 | Chinese Laser Press. All Rights Reserved 沪ICP备15018463号-20