
Lulin Fan, Tongjun Xu, Shun Li, Zhangli Xu, Jiancai Xu, Jianqiang Zhu, Baifei Shen, Liangliang Ji. Collimated gamma beams with high peak flux driven by laser-accelerated electrons[J]. High Power Laser Science and Engineering, 2023, 11(2): 02000e26
- High Power Laser Science and Engineering
- Vol. 11, Issue 2, 02000e26 (2023)
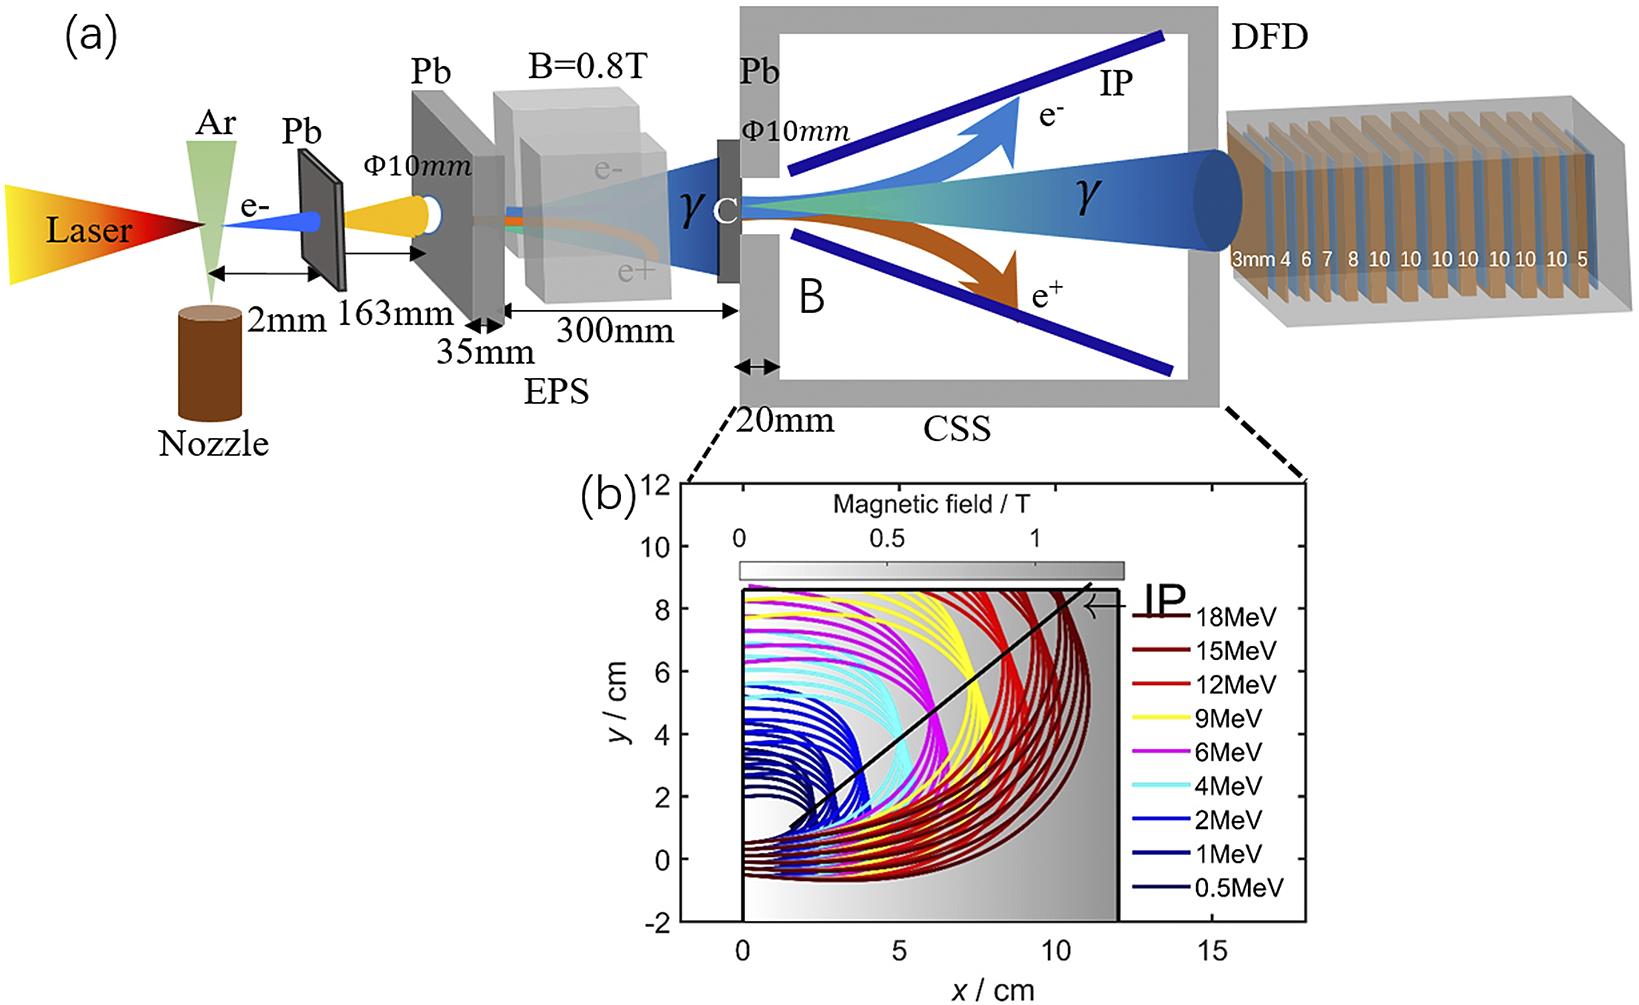
Fig. 1. Schematic of the experimental setup. (a) A laser pulse propagates through an argon gas target, and energetic electrons are generated and collide with the 2 mm lead target located 2 mm behind the gas target to generate gamma-ray beams. An electron–positron spectrometer (EPS) with an aperture of 10 mm located  behind the lead target with an acceptance divergence angle of
  is added to deflect the positrons and electrons and measure their energy spectra. The gamma-ray beam spectra are measured with a typical differential filtering detector (DFD) and a Compton-scattering spectrometer (CSS) with a gradual magnet, which increases linearly along the laser direction and fills the whole spectrometer. The converter target in the CSS is carbon with thickness of 2 mm. The CSS and DFD are added
  behind the lead target, which has an acceptance divergence angle of
  . (b) Trajectories of the converted electron beams dispersed in the gradual magnetic field. These trajectories represent incident electron beams with energies of 0.5–18 MeV. The converted electrons enter the magnetic field with different transverse positions of
  and different angles of [–
 .
.
behind the lead target with an acceptance divergence angle of is added to deflect the positrons and electrons and measure their energy spectra. The gamma-ray beam spectra are measured with a typical differential filtering detector (DFD) and a Compton-scattering spectrometer (CSS) with a gradual magnet, which increases linearly along the laser direction and fills the whole spectrometer. The converter target in the CSS is carbon with thickness of 2 mm. The CSS and DFD are added behind the lead target, which has an acceptance divergence angle of . (b) Trajectories of the converted electron beams dispersed in the gradual magnetic field. These trajectories represent incident electron beams with energies of 0.5–18 MeV. The converted electrons enter the magnetic field with different transverse positions of and different angles of [–. 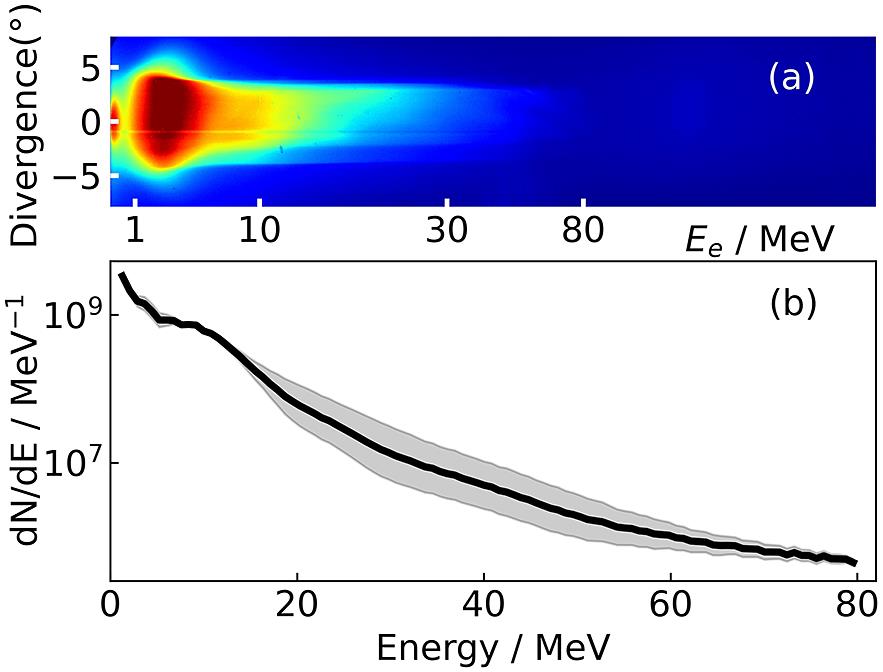
Fig. 2. (a) Raw signal of the laser-accelerated electron beam recorded in the IP. (b) Extracted energy spectrum of the energetic electron beam. The black line represents the geometric mean value of the data of two shots. The shaded region represents uncertainty.
Fig. 3. (a)–(c) Spatial distribution of the electron beam recorded in the IP corresponding to different energies, namely,  MeV,
MeV, E > 9.2 MeV and E > 15 MeV. (d) Electron beam divergence angles of four continuous shots. The blue and red lines represent horizontal and vertical divergence angles, respectively.
MeV, Fig. 4. (a) Raw-data of the gamma-photon signal recorded by the DFD. Raw-data of positrons (b) and electrons (c) recorded by the CSS. (d) Experimental spectra from the CSS (black solid), the DFD (red cross) and GEANT4 simulation with the experimental electrons as input (blue solid), within the divergence angle of  . These horizontal error bars represent 13 energy intervals and the vertical error bars represent uncertainty for the DFD. The black line represents the geometric mean value of the data and the shaded region represents uncertainty for the CSS.
. These horizontal error bars represent 13 energy intervals and the vertical error bars represent uncertainty for the DFD. The black line represents the geometric mean value of the data and the shaded region represents uncertainty for the CSS. Fig. 5. (a) The divergence of gamma-ray beam by GEANT4 simulation with energy  . (b) Gamma-ray photon (
 ) yields and divergence (FWHM) versus different lead thicknesses. The simulation is performed with the experimental electrons as input.
. (b) Gamma-ray photon () yields and divergence (FWHM) versus different lead thicknesses. The simulation is performed with the experimental electrons as input. 
Set citation alerts for the article
Please enter your email address
© Copyright 2018-2021 | Chinese Laser Press. All Rights Reserved 沪ICP备15018463号-20