Author Affiliations
1Key Laboratory of Optoelectronic Technology & Systems (Chongqing University), Ministry of Education, and College of Optoelectronic Engineering, Chongqing University, Chongqing 400044, China2National Center for Nanoscience and Technology, Beijing 100190, China3e-mail: dai@nanoctr.cn4e-mail: wgchu@nanoctr.cnshow less
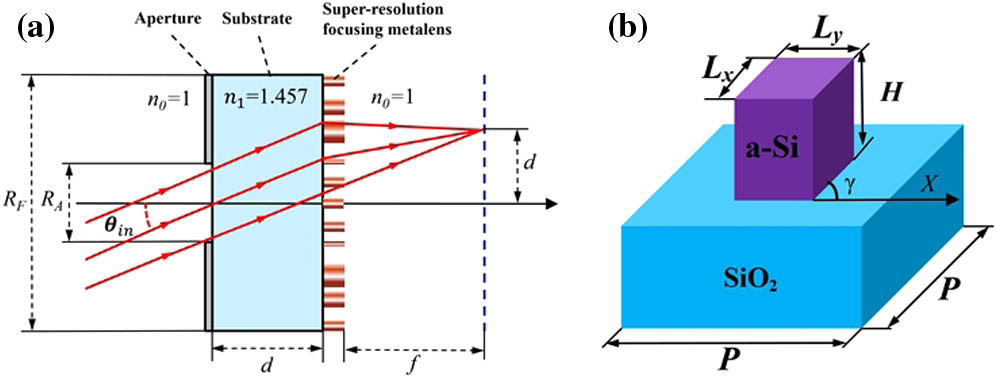
Fig. 1. Flat-field superoscillation metalens. (a) Schematic illustration of focusing of off-axis light by a flat-field superoscillation metalens. (b) Schematic illustration of the a-Si dielectric meta-atom for geometric-phase manipulation in the metalens.
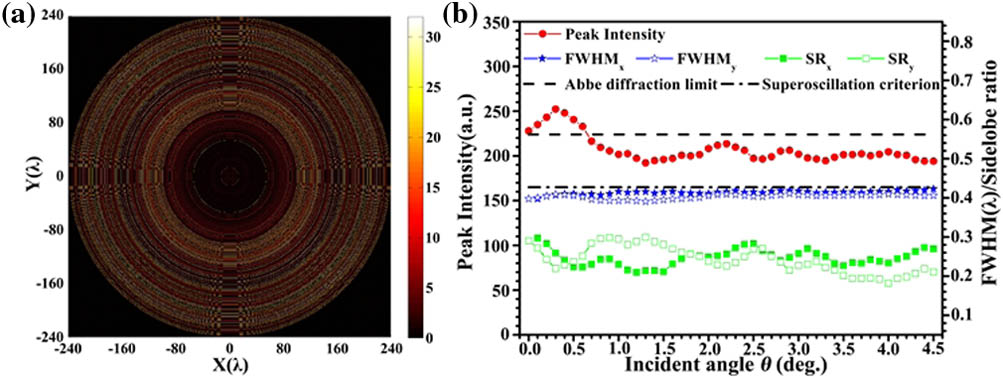
Fig. 2. Results of the optimized flat-field superoscillation metalens. (a) Phase profile of the lens φ(x,y); (b) peak intensity (red solid), full width at half-maximum FWHMx (blue solid) and FWHMy (blue open) in x and y directions, and sidelobe ratio in x (green solid) and y (green open) directions at different incident angles.
Fig. 3. (a) Diagram of the superoscillation focusing metalens arrangement in square lattice array, where inset gives the arrangement of the meta-atoms located at the device center. (b) SEM picture of the central part of the fabricated flat-field superoscillation metalens.
Fig. 4. Focusing performance of the flat-field superoscillation metalens. (a), (e) Simulation results of the optical intensity profile on the designed focal plane for different incident angles of 0°, 0.5°, 1.0°, 1.5°, 2.0°, 2.5°, 3.0°, 3.5°, 4.0°, and 4.5°; (b), (f) intensity distribution curves in x direction (blue) and y direction (red), both crossing the focal spot center; (c), (g) experimental results of the optical intensity profile on the designed focal plane for the 10 incident angles; (d), (h) intensity distribution curves in x direction (blue) and y direction (red), both crossing the focal spot center; (i) focusing performance parameters obtained from the experimental results, including peak intensity (red), spot size (FWHM) in x (blue solid) and y (blue open) directions and sidelobe ratio in x (green solid) and y (green open) directions; (j) spot displacement on the focal plane for the simulation result (red) and experimental result (blue).
Fig. 5. Optical propagation properties on the incident plane (xz plane) at different incident angles. Simulation results: (a), (e) intensity distribution on xz propagation plane; (b), (f) peak intensity (red), FWHM (blue), and sidelobe ratio (green) along the propagation direction. Experimental results: (c), (g) intensity distribution on the xz propagation plane; (d), (h) peak intensity (red), FWHM (blue), and sidelobe ratio (green) along the propagation direction. The Abbe diffraction limit and superoscillation criterion are displayed by the dashed curve and dashed-dotted curve, respectively. The focal plane is denoted by the vertical dashed line.
Fig. 6. Poynting vector on the incident plane (xz plane) at different incident angles, where the blue arrows give the direction of energy flow.
No. of Rings | Phase of Rings () |
---|
#1–#140 | 00C040000J500000006000006000000D00000000100000000000000000420000000400000000000000000000020002000000000000000002000000000000000N001000063302 | #141–#280 | 000301442010C44000101104400004443100544641440054454040415474570FD4001F000C88A00910B207003005546W0CQG010QJ09H0F5XH2SG2F7PGQBE1F2P00W64CP44M32 | #281–#420 | APA6A7P7B4AQG4QBQ4523VZ8EHKFN7N3322Y562F73A22EG325250YQ3312175035E6C290RB40S002XB10330210R6Z0D50305V2004005Y014M171YQ03P0KAF4K60448D010A90H0 | #421–#562 | M0R001E4C20Q84463X20MAM20054P8A0C2E0B070B0W0HC6WJR200N00X12M0P0F0H0GD0S4M2C383K0H0K0BX8S1027Z5P2Z0Q2H2JAGS3Q060M110E063MC20072200Q3G0E00N0M0D0 |
|
Table 1. Phase Distribution along Radial Direction