• High Power Laser Science and Engineering
  • Vol. 6, Issue 2, 02000e14 (2018)
Zhaoyang Jiao1、*, Ping Shao1, Dongfeng Zhao1, Rong Wu1, Lailin Ji2, Li Wang1, Lan Xia2, Dong Liu2, Yang Zhou1, Lingjie Ju1, Zhijian Cai1, Qiang Ye1, Zhanfeng Qiao1, Neng Hua1, Qiang Li1, Wei Pan1, Lei Ren1, Mingying Sun1, Jianqiang Zhu1, and Zunqi Lin1
Author Affiliations
  • 1National Laboratory on High Power Laser and Physics, Shanghai Institute of Optics and Fine Mechanics, Chinese Academy of Sciences, Shanghai 201800, China
  • 2Shanghai Institute of Laser Plasma, Shanghai 201800, China
  • show less
    DOI: 10.1017/hpl.2018.8 Cite this Article Set citation alerts
    Zhaoyang Jiao, Ping Shao, Dongfeng Zhao, Rong Wu, Lailin Ji, Li Wang, Lan Xia, Dong Liu, Yang Zhou, Lingjie Ju, Zhijian Cai, Qiang Ye, Zhanfeng Qiao, Neng Hua, Qiang Li, Wei Pan, Lei Ren, Mingying Sun, Jianqiang Zhu, Zunqi Lin. Design and performance of final optics assembly in SG-II Upgrade laser facility[J]. High Power Laser Science and Engineering, 2018, 6(2): 02000e14 Copy Citation Text show less
    The sketch of FOA in SG-II Upgrade facility.
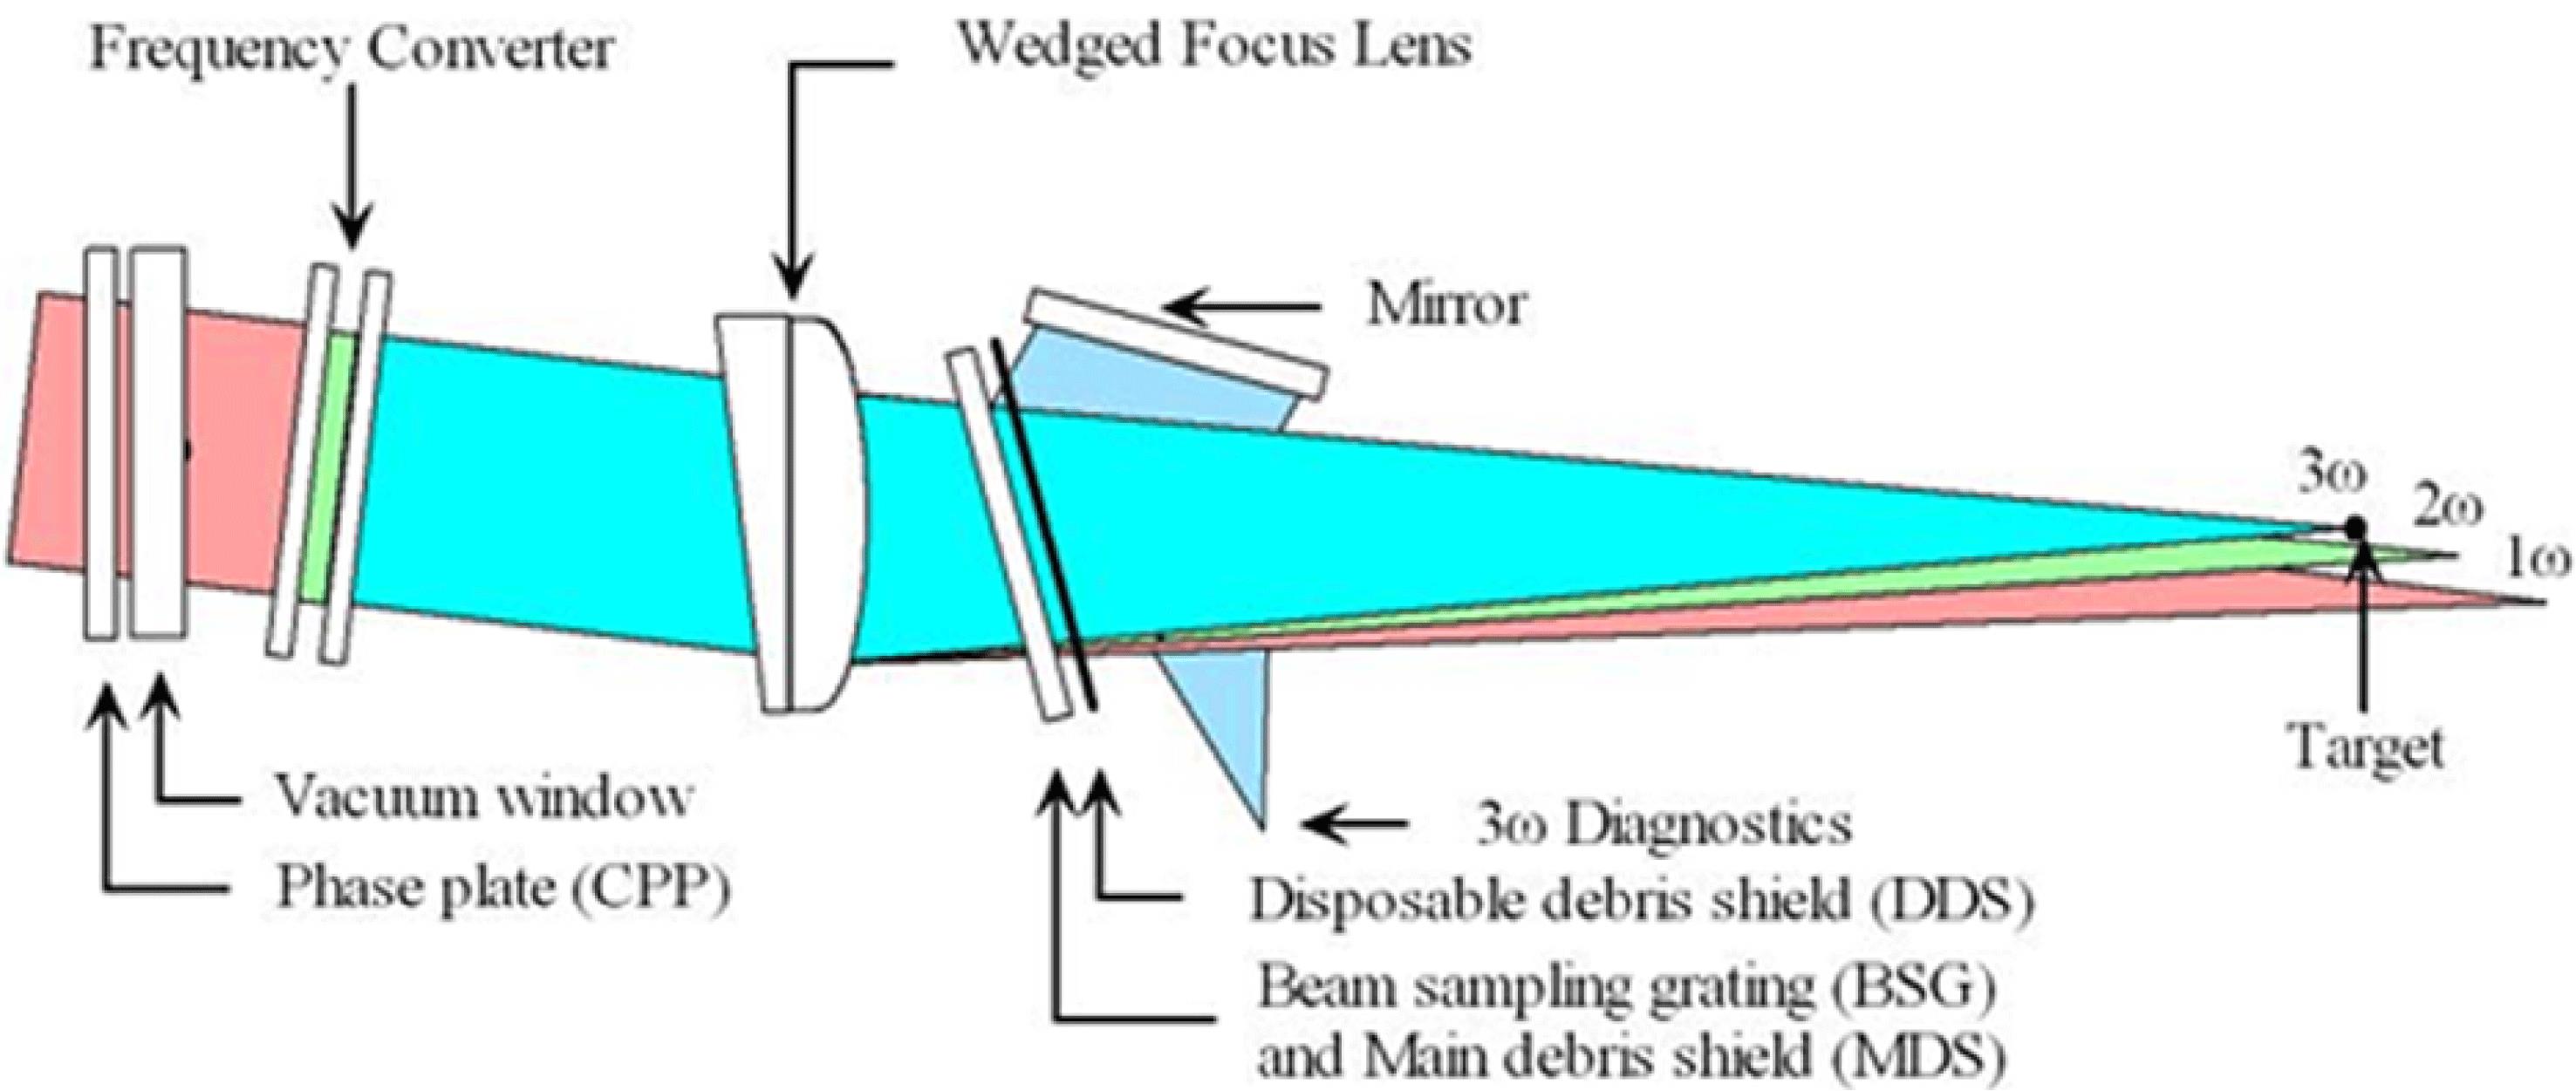
    Fig. 1. The sketch of FOA in SG-II Upgrade facility.
    Final optimized ghost image distribution result of FOA.
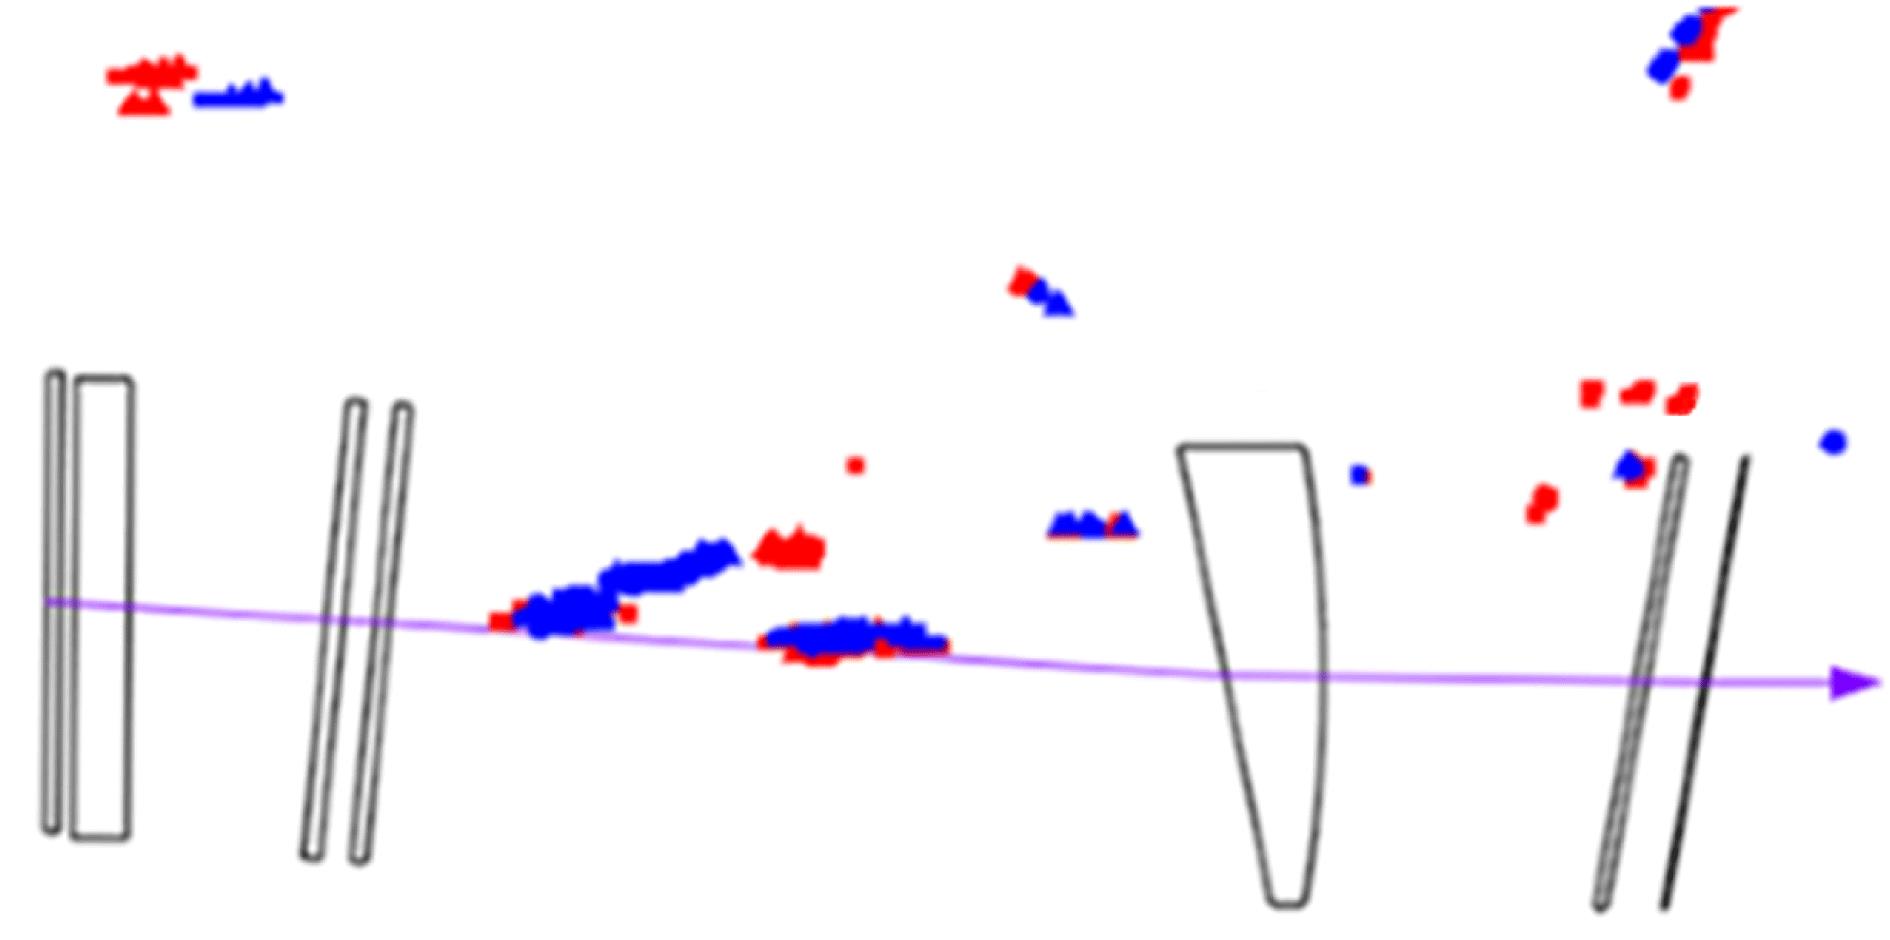
    Fig. 2. Final optimized ghost image distribution result of FOA.
    Focal spot distribution of FOA.
    Fig. 3. Focal spot distribution of FOA.
    Diameter for 95% of the focal spot energy versus the optical axis deviation.
    Fig. 4. Diameter for 95% of the focal spot energy versus the optical axis deviation.
    Concrete structure design of FOA.
    Fig. 5. Concrete structure design of FOA.
    Experimental setup of FOA in the target system.
    Fig. 6. Experimental setup of FOA in the target system.
    Experimental parameters of energy, power and fluence.
    Fig. 7. Experimental parameters of energy, power and fluence.
    Measurement of and energy and frequency conversion efficiency.
    Fig. 8. Measurement of and energy and frequency conversion efficiency.
    Experimental setup for perforation efficiency testing.
    Fig. 9. Experimental setup for perforation efficiency testing.
    (a) The top view and (b) the side view of the wedged focus lens.
    Fig. 10. (a) The top view and (b) the side view of the wedged focus lens.
    The angle deviation of the wedged focus lens.
    Fig. 11. The angle deviation of the wedged focus lens.
    Positioning for wedged focus lens measurement.
    Fig. 12. Positioning for wedged focus lens measurement.
    Light path of interference measurement of the wedged focus lens.
    Fig. 13. Light path of interference measurement of the wedged focus lens.
    Offline installation and adjustment of the wedged focus lens in the FOA.
    Fig. 14. Offline installation and adjustment of the wedged focus lens in the FOA.
    Optical path of online adjustment of FOA.
    Fig. 15. Optical path of online adjustment of FOA.
    Transmitted wavefront of the FOA (a) before adjustment and (b) after adjustment.
    Fig. 16. Transmitted wavefront of the FOA (a) before adjustment and (b) after adjustment.
    Focal spot morphology (a) before adjustment and (b) after adjustment.
    Fig. 17. Focal spot morphology (a) before adjustment and (b) after adjustment.
    Stray light management by ground glass protection in the FOA.
    Fig. 18. Stray light management by ground glass protection in the FOA.
    Sketch of the sinusoidal surface of the ground glass.
    Fig. 19. Sketch of the sinusoidal surface of the ground glass.
    Morphology of the ground glass in the electron microscope (a) before HF etching and (b) after HF etching.
    Fig. 20. Morphology of the ground glass in the electron microscope (a) before HF etching and (b) after HF etching.
    Beam diameter 310 mm
    Focal length 2.2 m
    Frequency conversion efficiency 70%
    Focusability30 DL@351nm (95% energy)
    Fluence
    Table 1. Main design specifications for the FOA.
    Fluence PulseConversionFilling Total
    ()duration (ns)efficiencyfactorthickness (mm)
    4 3 60% 0.6 162
    Table 2. Calculation parameters for B integral.
    Shot number energy (J)Hole (m)Perforation efficiency (%)
    12813 800 97.9
    22997 800 96.7
    33105 800 98.4
    427151000 99.2
    52471 800 98.8
    Table 3. Results of the laser perforation efficiency.
    Zhaoyang Jiao, Ping Shao, Dongfeng Zhao, Rong Wu, Lailin Ji, Li Wang, Lan Xia, Dong Liu, Yang Zhou, Lingjie Ju, Zhijian Cai, Qiang Ye, Zhanfeng Qiao, Neng Hua, Qiang Li, Wei Pan, Lei Ren, Mingying Sun, Jianqiang Zhu, Zunqi Lin. Design and performance of final optics assembly in SG-II Upgrade laser facility[J]. High Power Laser Science and Engineering, 2018, 6(2): 02000e14
    Download Citation