• Chinese Physics B
  • Vol. 29, Issue 8, (2020)
Yang Yang1、†, Qiang Zhang2, Wenbo Mi3, and Xixiang Zhang2
Author Affiliations
  • 1Beijing National Laboratory for Condensed Matter Physics, Institute of Physics, Chinese Academy of Sciences, Beijing 0090, China
  • 2PSE Division, King Abdullah University of Science and Technology (KAUST), Thuwal 3955-6900, Kingdom of Saudi Arabia
  • 3Tianjin Key Laboratory of Low Dimensional Materials Physics and Preparation Technology, School of Science, Tianjin University, Tianjin 0054, China
  • show less
    DOI: 10.1088/1674-1056/ab9615 Cite this Article
    Yang Yang, Qiang Zhang, Wenbo Mi, Xixiang Zhang. Lattice deformation in epitaxial Fe3O4 films on MgO substrates studied by polarized Raman spectroscopy[J]. Chinese Physics B, 2020, 29(8): Copy Citation Text show less
    Schematic drafts for (a) normal and (b) cross-sectional scattering configurations. The polarization direction of incident laser is along the X axis, while the polarization direction of scattered is along the X and Y axes for parallel (VV) and crossed (VH) scattering geometries, respectively.
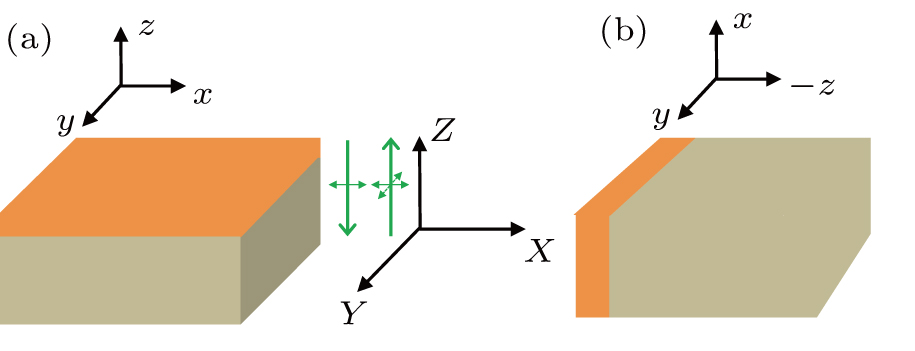
    Fig. 1. Schematic drafts for (a) normal and (b) cross-sectional scattering configurations. The polarization direction of incident laser is along the X axis, while the polarization direction of scattered is along the X and Y axes for parallel (VV) and crossed (VH) scattering geometries, respectively.
    Polarized Raman spectra of the Fe3O4 film of 217 nm obtained in the normal [(a) and (b)] and cross-sectional [(c) and (d)] scattering configuration.
    Fig. 2. Polarized Raman spectra of the Fe3O4 film of 217 nm obtained in the normal [(a) and (b)] and cross-sectional [(c) and (d)] scattering configuration.
    Thickness-dependent peak position and bandwidth (FWHM) of Eg, T2g(2) and A1g modes.
    Fig. 3. Thickness-dependent peak position and bandwidth (FWHM) of Eg, T2g(2) and A1g modes.
    Different Raman modes and their corresponding numerically fitted curves. Black circles represent the experimental results, the red lines are the fitting results.
    Fig. 4. Different Raman modes and their corresponding numerically fitted curves. Black circles represent the experimental results, the red lines are the fitting results.
    (a) bandwidth and (b) correlation length for T2g(1) mode as a function of thickness. The inset shows the thickness dependence of the ratio of half-widths at half maximum on low- and high-frequency sides (Γl/Γh).
    Fig. 5. (a) bandwidth and (b) correlation length for T2g(1) mode as a function of thickness. The inset shows the thickness dependence of the ratio of half-widths at half maximum on low- and high-frequency sides (Γl/Γh).
    Yang Yang, Qiang Zhang, Wenbo Mi, Xixiang Zhang. Lattice deformation in epitaxial Fe3O4 films on MgO substrates studied by polarized Raman spectroscopy[J]. Chinese Physics B, 2020, 29(8):
    Download Citation