
Efthymis Serpetzoglou, Ioannis Konidakis, George Kourmoulakis, Ioanna Demeridou, Konstantinos Chatzimanolis, Christos Zervos, George Kioseoglou, Emmanuel Kymakis, Emmanuel Stratakis. Charge carrier dynamics in different crystal phases of CH3NH3PbI3 perovskite[J]. Opto-Electronic Science, 2022, 1(4): 210005
- Opto-Electronic Science
- Vol. 1, Issue 4, 210005 (2022)
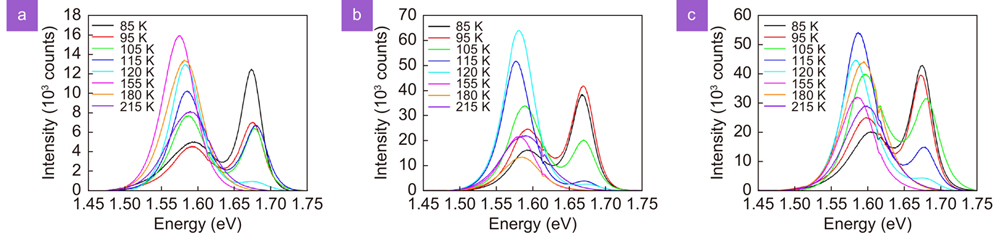
Fig. 1. μPL spectra following excitation at 543 nm of the (a ) Glass/CH3NH3PbI3, (b ) Glass/ITO/PEDOT:PSS/CH3NH3PbI3 and (c ) Glass/ITO/PTAA/CH3NH3PbI3 architectures.
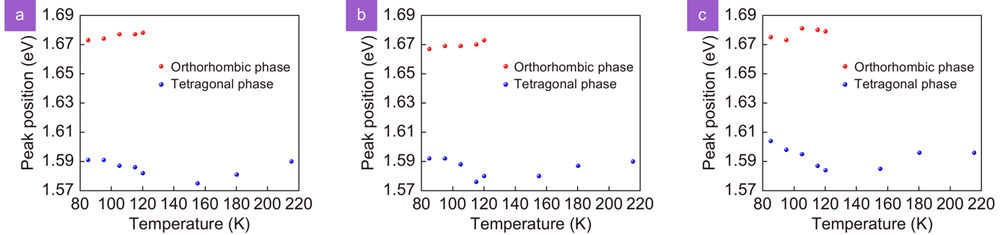
Fig. 2. Shift of the μPL emission peak as a function of temperature for (a ) Glass/CH3NH3PbI3,(b ) Glass/ITO/PEDOT:PSS/CH3NH3PbI3 and (c ) Glass/ITO/PTAA/CH3NH3PbI3 architectures for the orthorhombic (red solid circles) and tetragonal (blue solid circles) perovskite crystal phases.
Fig. 3. FWHM of the PL peaks corresponding to the orthorhombic (black diamonds) and tetragonal (red circles) phases of CH3NH3PbI3 as a function of temperature (a ) Glass/CH3NH3PbI3, (b ) Glass/ITO/PEDOT:PSS/CH3NH3PbI3 and (c ) Glass/ITO/PTAA/CH3NH3PbI3. Green solid lines show the fitting acquired by the temperature-independent inhomogeneous broadening (Γ0) and the interaction between charge carriers and longitudinal optical phonons (LO-phonons), as described by the Fröhlich Hamiltonian.
Fig. 4. Optical density (ΔOD) vs. wavelength at various delay times for Glass/ITO/PEDOT:PSS/CH3NH3PbI3 architecture at (a ) 85 K, (b ) 120 K and (c ) 180 K.
Fig. 5. Optical density ΔOD vs. wavelength at various delay times for Glass/ITO/PTAA/CH3NH3PbI3 configuration at (a ) 85 K, (b ) 120 K and (c ) 180 K.
Fig. 6. Optical density (ΔOD) peaks wavelength as a function of temperature for Glass/ITO/PEDOT:PSS/CH3NH3PbI3 architecture and Glass/ITO/PTAA/CH3NH3PbI3configurations, as extracted from TAS spectra at t = 0 ps (see Fig. 4 and Fig. 5 blue lines).
Fig. 7. Normalized optical density (ΔOD) vs. delay time for Glass/ITO/PEDOT:PSS/CH3NH3PbI3and Glass/ITO/PTAA/CH3NH3PbI3configurations for the orthorhombic phase at (a ) 85 K, (b ) 120 K and for the tetragonal phase at (c ) 120 K and (d ) 180 K. Symbols present the transient band edge bleach kinetics, while solid lined present the decay exponential fitting. Insets are shown the initial time scale for Glass/ITO/PTAA/CH3NH3PbI3.
| ||||||||||||||||||||||||||||||||||||||||||||||||||||||||||||||||
Table 1. Time components and bimolecular recombination rate (k2) for the Glass/ITO/PEDOT:PSS/CΗ3NΗ3PbΙ3 and Glass/ITO/PTAA/CH3NH3PbI3 architectures.


Set citation alerts for the article
Please enter your email address

© Copyright 2018-2021 | Chinese Laser Press. All Rights Reserved 沪ICP备15018463号-20