
Hao Cheng, Pei-Feng Han, You-Wen Su. Sliding and accumulation characteristics of loose materials and its influencing factors based on discrete element method [J]. Acta Physica Sinica, 2020, 69(16): 164501-1
- Acta Physica Sinica
- Vol. 69, Issue 16, 164501-1 (2020)
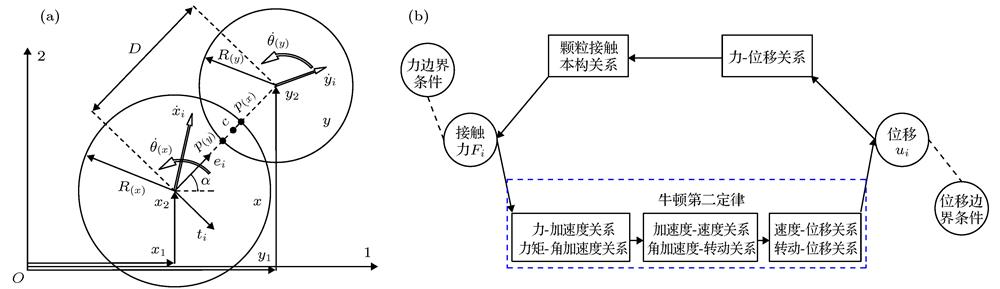
Fig. 1. Granular computing iteration diagram: (a) Relationship between force and displacement; (b) theoretical computing.
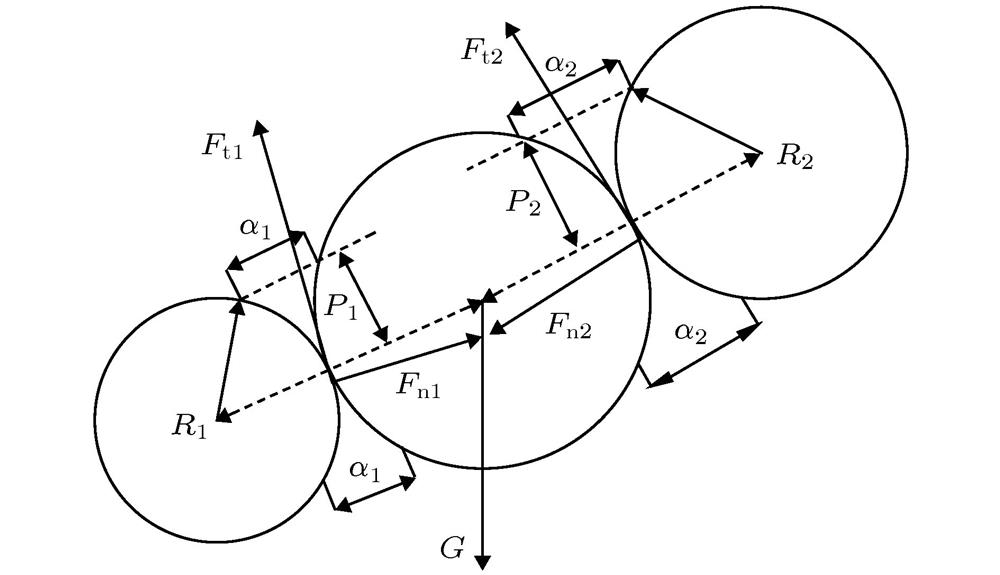
Fig. 2. The forces by particles interacting.
Fig. 3. Diagram of normal force of granular: (a) Normal overlap; (b) position relations.
Fig. 4. Diagram of sliding accumulation model of loose accumulation body: (a) Three-dimensional numerical model; (b) side of view; (c) vertical view.
Fig. 5. Diagram large sample of single particle: (a) – Z of view; (b) +Y of view.
Fig. 6. Comparison of cumulative volume between experiment results[30] and DEM simulation results of granular after sliding.
Fig. 7. Loose materials the whole process of sliding accumulation(+X view): (a) t = 400 ms; (b) t = 600 ms; (c) t = 860 ms; (d) t = 1 000 ms; (e) t = 1 200 ms; (f) t = 2 000 ms; (g) accumulation process changes shape.
Fig. 8. The final diagram of plane accumulation form.
Fig. 9. Influence of stone content on the accumulation form: (a) Stroke; (b) accumulation width; (c) maximum thickness; (d) accumulation area.
Fig. 10. Static accumulation angle boundary contour acquire.
Fig. 11. Schematic diagram of volume calculation of accumulation area.
Fig. 12. Influence of different stone contents on the accumulation volume at a slope of 65°.
Fig. 13. Influence of slope on the accumulation form: (a) Stroke; (b) accumulation width; (c) maximum thickness; (d) accumulation area.
Fig. 14. Plane accumulation morphology under different slope: (a) Stone content 0%; (b) stone content 30%; (c) stone content 50%; (d) stone content 70%.
Fig. 15. The results of the sliding accumulation simulation of stone content 50% loose granular with different slopes: (a) 30°; (b) 45°; (c) 65°.
Fig. 16. Influence of different slope of 50% stone content on the accumulation volume.
Fig. 17. The volume comparison of granular with different slopes with 50% stone content: (a) 30°; (b) 45°; (c) 65°.
Fig. 18. Influence of different stone contents on cumulative mass at slope of 65°.
Fig. 19. Influence of different slope on cumulative mass at stone content of 50%.
Fig. 20. The cumulative mass comparison of granular with different slopes with 50% stone content: (a) 30°; (b) 45°; (c) 65°.
Fig. 21. Granular average kinetic energy distribution characteristics: (a)Translational kinetic energy; (b) rotational kinetic energy.
Fig. 22. Time-history curve of average normal contact force between granulars: (a) x direction; (b) y direction; (c) z direction.
Fig. 23. Time-history curve of average tangential contact force between granulars: (a) x direction; (b) y direction; (c) z direction.
Fig. 24. Time-history curve of average contact force overlap between granulars: (a) Normal; (b) tangential.
Fig. 25. Probability density functions (PDF) of average normal contact force between granulars: (a) x direction; (b) y direction; (c) z direction.
|
Table 1.
Main computational parameters of discrete element simulation for loose granular accumulation.
松散颗粒堆积离散元模拟的主要计算参数
|
Table 2.
Measured value of static accumulation angle under different computing conditions.
不同计算条件下静堆积角测量值
|
Table 3.
Average kinetic energy and contact force of granular in the process of sliding accumulation.
滑动堆积过程中颗粒的平均动能和接触力均值
| ||||||||||||||||||||||||||||||||||
Table 4.
Summary table of simulation results.
模拟结果汇总表

Set citation alerts for the article
Please enter your email address
© Copyright 2018-2021 | Chinese Laser Press. All Rights Reserved 沪ICP备15018463号-20