
Wei Wang, Yiguang Yang, Weihong Zhang, Xujin Li, Degang Xu. Pulsed-Laser-Sound-Signal Detection Based on Frequency-Domain Energy Detector[J]. Chinese Journal of Lasers, 2019, 46(7): 0701008
- Chinese Journal of Lasers
- Vol. 46, Issue 7, 0701008 (2019)
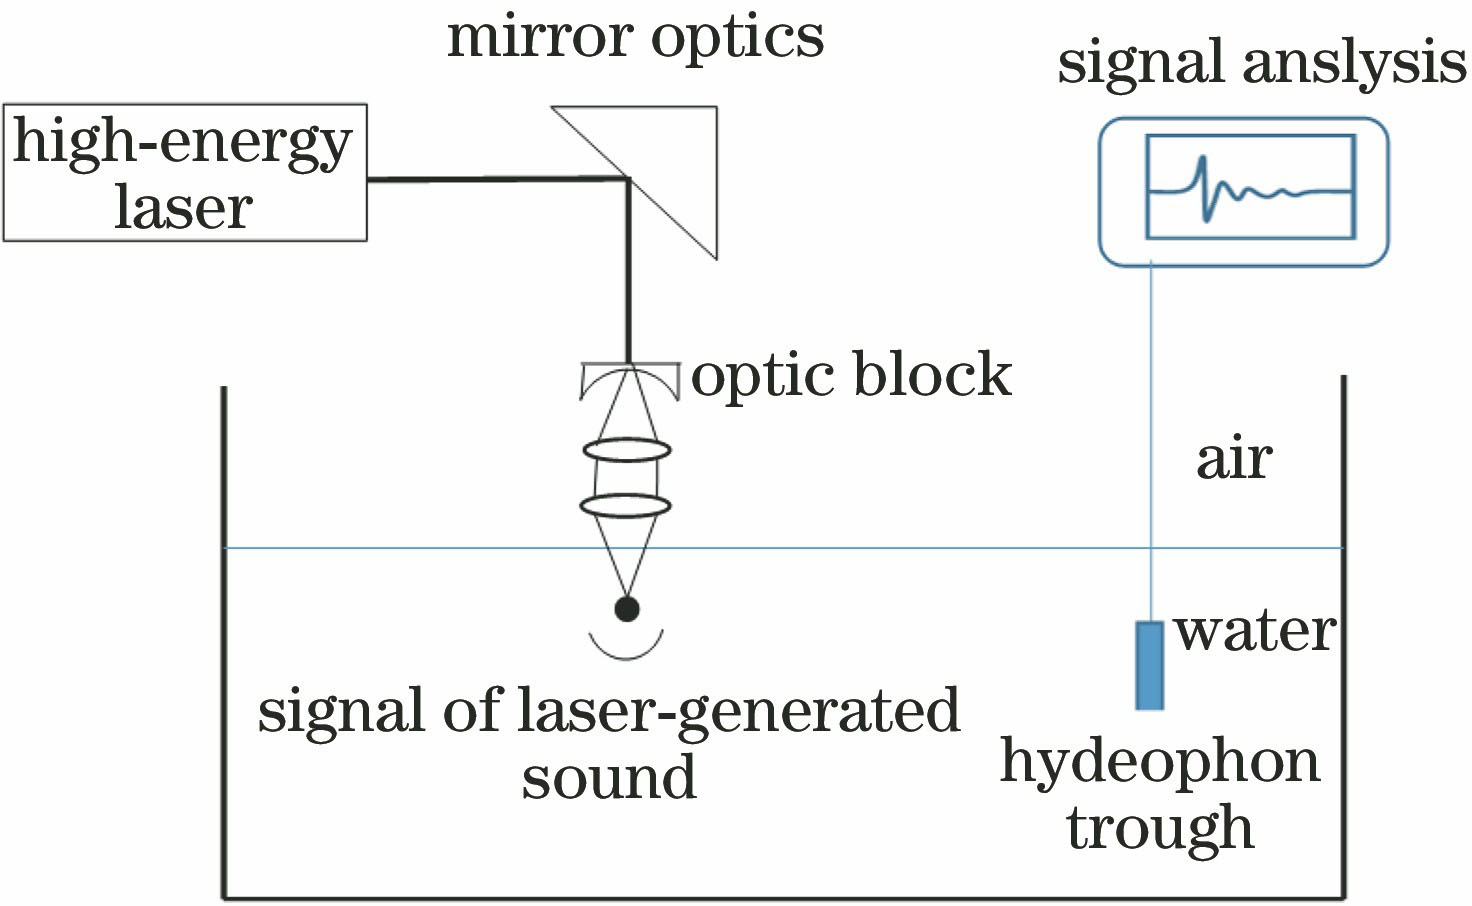
Fig. 1. Experimental setup diagram of generation and collection of laser acoustic signal
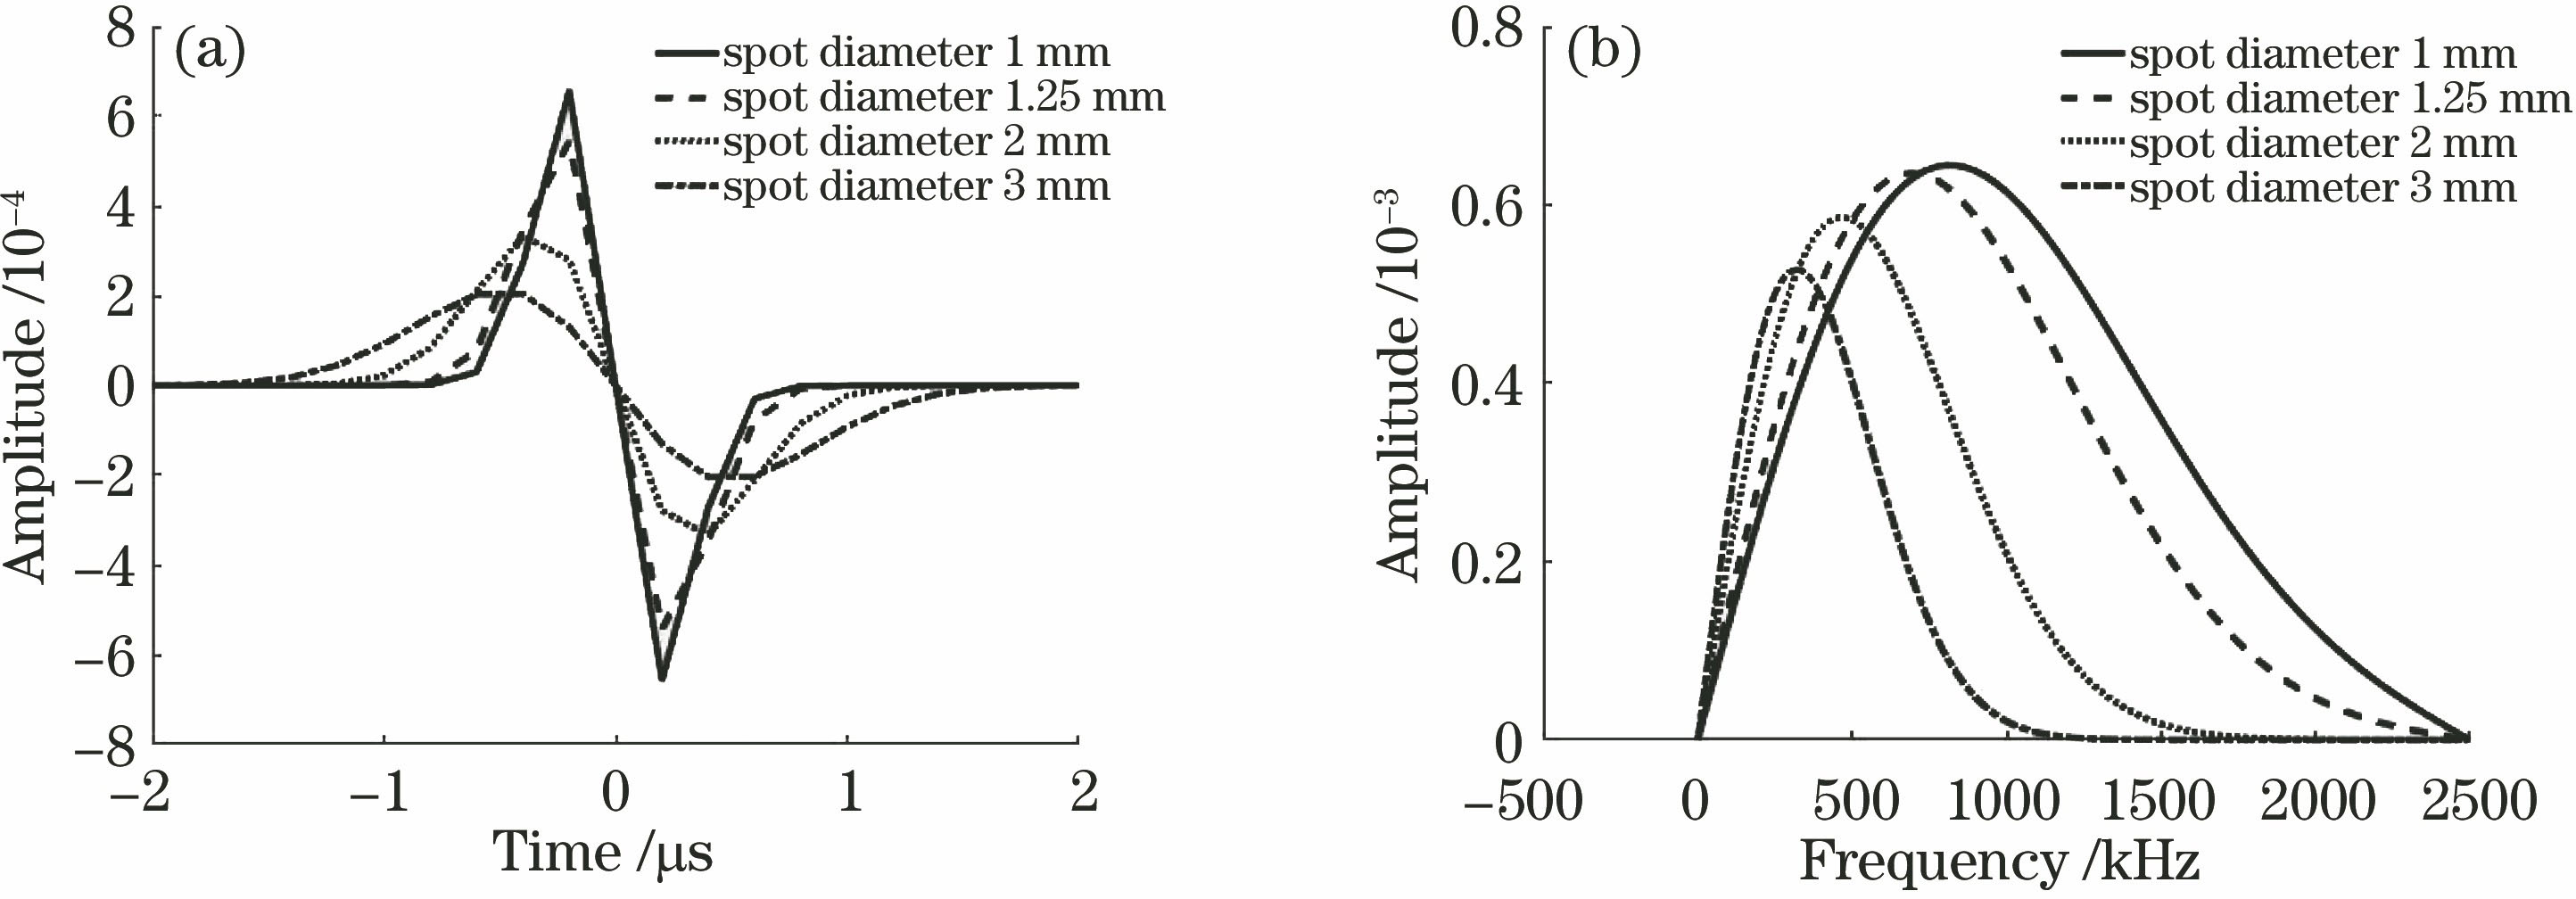
Fig. 2. Time-domain and frequency-domain waveforms under different spot diameters. (a) Time-domain waveform; (b) frequency-domain waveform
Fig. 3. Time-domain and frequency-domain waveforms under different laser pulse widths. (a) Time-domain waveform; (b) frequency-domain waveform
Fig. 4. Time-domain waveform and power spectrum of laser-sound at different time. (a) Time-domain waveform; (b) power spectrum
Fig. 5. Power spectrum of laser-sound signal with different laser energies
Fig. 6. Absorptivity in underwater acoustic channel at different frequencies
Fig. 7. Simulation results of laser-sound signal under sound velocity gradient generated by HM2000 0370 ARGO buoy. (a) Sound velocity gradient generated by HM2000 0370 ARGO buoy; (b) three-dimensional propagation loss of laser-sound signal
Fig. 8. Power spectrum of laser-sound signals at different distances
Fig. 9. Pre-compensation energy detector
Fig. 10. Monte-Carlo simulation process of pre- compensation energy detector
Fig. 11. Monte-Carlo simulation result of pre- compensation energy detector
Fig. 12. Time-domain signal and power spectrum in tank test. (a) Time-domain signal; (b) power spectrum
| |||||||||||||||||||||||
Table 1. Statistical results of signal power under different time
| |||||||||||||||||||||||||||||||||||
Table 2. Statistical results of laser-sound signal power with different laser powers

Set citation alerts for the article
Please enter your email address
© Copyright 2018-2021 | Chinese Laser Press. All Rights Reserved 沪ICP备15018463号-20