
Liping TIAN, Lingbin SHEN, Lin CHEN, Lili LI, Ping CHEN, Jinshou TIAN. Spatio-temporal Resolution Studies on a Synchronous Streak Tube[J]. Acta Photonica Sinica, 2021, 50(4): 143
- Acta Photonica Sinica
- Vol. 50, Issue 4, 143 (2021)
Abstract
Keywords
0 Introduction
The Streak Cameras (SC) can work in two mode which are single-shot mode for strong light signal and synchroscan repetitive mode for weak light signal. In single-shot mode, a ramp voltage applied on the scanning deflector to realize the conversion of high-speed time signal to low-speed space signal. In synchroscan mode, we utilizes a sinusoidal voltage, in synchronism with the laser pulse train and repetition rate of the recorded light pulse, as the scanning voltage applied to the deflection system to realize the diagnosis of the weak repetitive signal[
At present, several communities have designed and manufactured a number of streak tubes which have excellent performances including high spatial resolution and large effective working area. However, many of them works in single shot mode to achieve strong light diagnosis. In synchroscan mode, the most prominent synchroscan streak camera SC-10 is developed by Optronis in Germany which has achieved the scanning frequency of up to 250 MHz and a time resolution up to 2 ps. However, its spatial resolution is only 5 lp/mm @ 8 mm×2 mm[
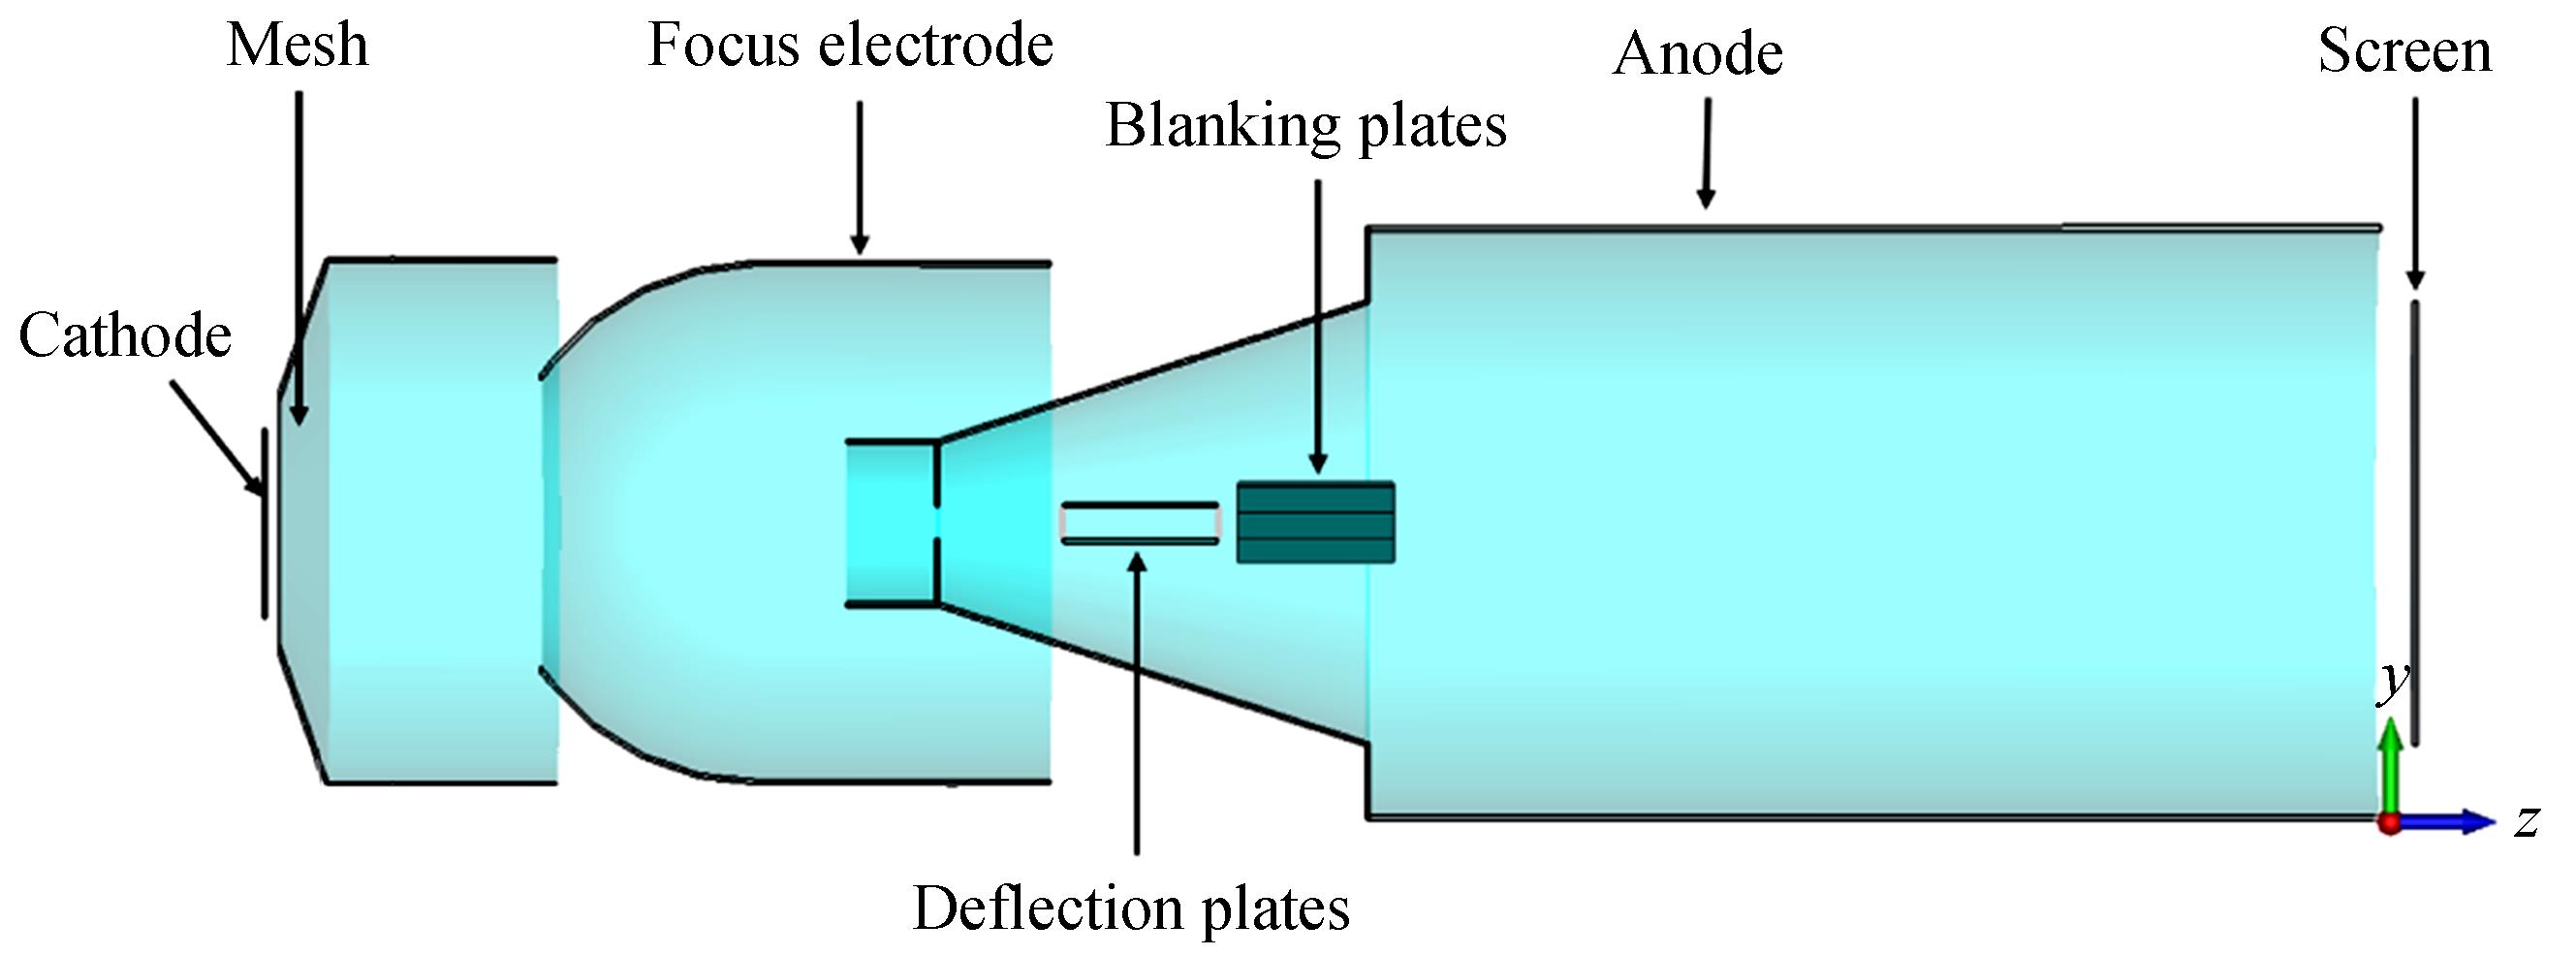
In this paper, a large format, high spatiotemporal resolution and high photocathode sensitivity streak tube (used in the 2200-streak camera of XIOPM) was designed, manufactured and tested. The streak tube consists of a plane photocathode, a plane ultra-fine structure mesh, a focus electrode, a pair of deflection plates, a pair of blanking plates, an anode and a phosphor screen. We adopt a plane mesh electrode to ensure the photoelectrons uniformly focusing through the entire cathode and to accelerate electrons to a high energy in a short distance, thereby improving the temporal resolution. The voltage between photocathode and mesh electrode is a crucial parameter for the streak tube, which has a great impact on the physical temporal resolution. The scanning velocity is also an essential factor for the dynamic spatial resolution. In addition, the dynamic spatial resolution, which shows a significant various trend, decreases with the scanning velocity. The numerical simulation results demonstrate that the static spatial resolution is higher than 25 lp/mm @ MTF=10% in sagittal direction over the whole working area of 18 mm×2 mm. The physical temporal resolution is better than 10 ps and the ultimate physical temporal resolution is about 2 ps. Besides, the static experimental test shows that the spatial resolution is higher than 25 lp/mm @ CTF=13%.
1 Theory and simulation details
The numerical simulations are based on the Finite Integral Technique, Monte Carlo method and 5th order Runge-Kutta method[
Fig.1 exhibits the streak tube model which components of a photocathode, an accelerating mesh, a focus system, a pair of deflection and blanking plates, anode and a phosphor screen. The incident ultrafast light pulse is first converted by the photocathode to an ultrafast electron pulse, correspondingly. Thus, the ultrafast electron pulses can be regarded as the replica of the light pulse. Then, the ultrafast electron pulse will be accelerated by the strong electrostatic field between the photocathode and the mesh electrode, and focused by the focus electrode, respectively. Furthermore, with the scanning signal on the deflection scanning system, the electron pulses can achieve time-to-space transformation[
![]()
Figure 1.Streak tube model and electric field density distribution along z-axis
The electrons emitted from the photocathode are not random and disorderly while the photocathode is illuminated by light. Some research and experiments suggest that the much more precise model of photoelectron emitted from the photocathode should be the Monte-Carlo sampling simulation with following considerations[
2 Results and discussions
2.1 Static characteristics of spatiotemporal resolution
The physical temporal resolution and spatial resolution in static mode is thoroughly investigated. To study the physical temporal resolution of our ST, we simulated the relationship between the physical temporal resolution and the off-axis distance(x) for different voltages applied between the photocathode and the accelerating electrode (Ug). The results show that the physical temporal resolution is a function of the Ug and x, as shown in Fig.2(a). The increasing Ug improves the physical temporal resolution, because the higher accelerating voltage shortens the transit time of photoelectrons in the streak tube, which in turn shortens the transit time dispersion of the photoelectrons. Furthermore, with the increasing of x, the physical temporal resolution gradually deteriorates, because the edge field effect of the electric lens will lead different force between electron bunches emitted from different off-axis distances and center of the cathode. Also, the path differences of the photoelectrons is greater on edge of the effective working area than in the center of the cathode. Moreover, the temporal resolution over the whole effective photocathode of the streak tube is in the range of 1~14 ps. From previous research[
![]()
Figure 2.Physical temporal resolution
The electron beam emitted at the cathode center is only affected by the spherical aberration, while the off-axis points are affected by several aberrations including distortion, coma and field curvature aberrations at the same time. Thus, the further away from the axis, the lower the spatial resolution is. Fig.3 describes the simulated static Spatial Modulation Transfer Function (SMTF) in sagittal direction while Ug=700 V. Obviously, it shows a significant tendency while the off-axis distance is increasing, the static spatial resolution is gradually decreasing. It is worth noting that the spatial resolution is higher than 25 lp/mm even though the off-axis distance is 9 mm.
![]()
Figure 3.Static SMTF in sagittal direction
2.2 Dependence of dynamic spatial resolution on the deflector position
Electron beams emitted from the cathode have time dispersion due to different initial energy and azimuth. Therefore, the electron beams will first disperse, and then focus into a point at the screen. Significantly, the electron beam diameter decreases gradually when it runs to the entrance of the deflectors. The theoretical study shows that reducing the diameter of the electron beam spot at the entrance of the deflector can reduce the deflection defocusing[
![]()
Figure 4.DSMTF of the ST at different
2.3 Dependence of dynamic spatial resolution on the scanning velocity
Fig.5 describes the simulated dynamic spatial resolution variation for different full screen scanning time (Tscreen) ranging from 0.8 to 0.36 ns and different off-axis distance (x) in the interval of 0~8 mm. Simulation results show a pronounced tendency toward spatial resolution versus Tscreen and x behavior. The increasing Tscreen decreases the scanning velocity and deflection defocusing, thereby improving the spatial resolution. When the off-axis distance increases, the aberrations will increase, resulting in a large spatial dispersion of the photoelectrons, which will reduce the spatial resolution.
![]()
Figure 5.Dynamic spatial resolution of the ST versus scanning frequency
The greater the scanning deflection distance of the electron bunches at the screen, the lower dynamic spatial resolution is. It is because that the electron bunches have a large space dispersion at the operation of fast-speed scanning. In this paper, an appropriate scanning point is selected so that the electron beams deviate from the center of the screen about 12 mm to achieve a better spatial resolution. Fig.6 shows the dynamic spatial modulation transfer function at different point of cathode along sagittal direction at Tscreen=0.5 ns. It is obvious that the dynamic spatial resolution gradually decreases with the increasing of the off-axis distance, and the dynamic spatial resolution is higher than 16 lp/mm over the whole effective cathode working length of 18 mm.
![]()
Figure 6.DSMTF of the ST along
2.4 Temporal resolution on scanning mode
The temporal resolution is defined as the Full Width at Half Maximum (FWHM) of the intensity of the streak image on the screen while the temporal width of the incident light pulse can be almost neglected. It comes mainly from the Transit Time Spread (TTS) of the electrons initial angle dispersion, and the space dispersion caused by deflector scanning. In this paper, two electron bunches with an interval of 20 ps and FWHM of 100 fs are emitted from the inner surface of the cathode, as shown in Fig.7 (a). The scanning signal, shown in Fig.7 (b), is applied on the deflectors with amplitude of 750 V. To reduce the photon electrons spatial distortion produced by the scanning signal and improve the dynamic spatial resolution, we synchronize the electron beam in the range of quasi-linear area of the scanning signal. The scanning electron image is as shown in Fig.8. Two electron beams can be completely separated according to the Rayleigh Criterion and the FWHM of the scanning electrons on phosphor screen is only 5.6 ps. Thus, the temporal resolution of the ST is better than 5.6 ps @ Tscreen=0.5 ns.
![]()
Figure 7.M-C sampling electron pulse sequences and synchronous scan signal
![]()
Figure 8.Sweeping results of electron pulses with a duration of 20 ps
The dependence of the temporal resolution on Tscreen is thoroughly investigated in a numerical way. In this paper, Tscreen is varied from 0.8 to 0.36 ns, and the values of scanning voltage amplitude are fixed at ±750 V. Simulation result shows a pronounced linearity tendency in Fig.9. The decreasing Tscreen improves the temporal resolution due to the scanning velocity increasement, thereby increasing the deflection distance of photoelectron along the scanning direction during the same transit time. It can also be explained by a formula for temporal resolution which expressed as[15].
![]()
Figure 9.Temporal resolution versus scanning velocity
where e and m are the electron charge and mass. E,
3 Performances in 2200-synchroscan streak camera
Based on the previous theoretical electro-optical design, we have successfully manufactured a prototype of the streak tube with metal-ceramic-glass package, which is shown in Fig.10. The streak tube is potted with high magnetic permeability and high conductivity materials for packaging, which can improve its anti-electromagnetic interference ability. The internal surface of the ceramic is deposited with Cr2O3, which would have great contribution in avoiding the electric breakdown. A S-20 photocathode and P-43 phosphor screen are employed to response visible light and to obtain a high electron-optical conversion efficiency. We test the initial performance of the tube including Photocathode Radiant Sensitivity (PRS) and Modulation Transfer Function (MTF) in the STR test station, detailed description seen in the articles[
![]()
Figure 10.The manufactured ST
![]()
Figure 11.Schematic diagram of PRS, MTF and spatial resolution test
The TAL light source is an electronically controlled LED plane light source , including LED light source at wavelength of 590 nm and 2 850 K color temperature polychromatic source, which can be used to test the spatial resolution and MTF. The BAL light source is integrated with ARW rotary wheel with a set of spectral filters, which can be adopted to test the PRS of the streak tube. The UNI is a camera of wide field of view with unit magnification, and the MR2 is an imaging radiometer of narrow field of view with magnification of 100, which can be used to resolved the details of the streak tube imaging.
3.1 Photocathode radiant sensitivity of the ST
Photocathode Radiant Sensitivity (PRS) of the streak tube is measured as ratio of photocathode current (mA) to incoming radiation power (W) at a specified wavelength, which is typically measured in mA/W. In the experiment, BAL light source with the power density of the photocathode irradiation light signal of 1 mW/m2 is irradiated on the photocathode after passing through a set of spectral filters from at least 400 nm to 850 nm. Otherwise, the optical aperture with Φ16 mm is set before the photocathode to improve the test precision by avoiding the non-uniformity light. And, a constant DC acceleration voltage of +200 V is applied between the cathode and the mesh electrode which is almost response to a saturated photocurrent. As shown in Fig.12, the maximum value of PRS reaches 51 mA/W at the wavelength of 400 nm, which will provide a good performance for a visible imaging system.
![]()
Figure 12.PRS of the streak tube
3.2 Static spatial resolution of the streak tube
In the spatial resolution test, we adopt the spatial modulation transfer function to evaluate the spatial resolution of the cathode center, and the resolution target method to evaluate it of the edge. In the experiment, a continuous optical signal with a central wavelength of 590 nm and a strength of 10 lx is used to irradiate photocathode to obtain the SMTF of the ST, as shown in Fig.13(a). It is evident that the central spatial resolution on the photocathode is higher than 35 lp/mm. We also test the spatial resolution of the edge in which the resolution target board is employed. It contains different resolutions of patterns in four directions. The test image result is shown as Fig.13(b). A resolution pattern image with 25 lp/mm is selected for analysis. The intensity distribution curve of the selected part in the insert image is shown as Fig.13(b). According to the Rayleigh criterion, we can conclude that the edge spatial resolution is higher than 25 lp/mm@ CTF=13%.
![]()
Figure 13.Measured static spatial performance of ST
3.3 Comparison of experimental and simulation results
In Fig.14, the blue curve is the experimental SMTF of the streak tube which shows the spatial resolution is 35 lp/mm @ MTF=19%, while the red curve is the theoretical of it which shows the spatial resolution is 35 lp/mm @ MTF=69%. Obviously, the experimental spatial resolution characteristic is lower than the theoretical value, which may be caused by the following reasons: 1) In the theoretical calculation, we did not consider the lateral dispersion effect of the electron spot caused by the space charge effect, which would deteriorate the spatial resolution; 2) In the experiment, we did not consider the coupling efficiency of MR2 and the streak tube. And, the assembly error of the streak tube will also affect the distribution of the electromagnetic field, thus reducing the spatial resolution.
![]()
Figure 14.SMTF comparison of experimental and simulation
4 Conclusion
We successfully demonstrate a synchronous streak tube with high spatiotemporal resolution over the whole working area of 18 mm×2 mm. The analyzations reveal that temporal resolution will improve with the increase of the field between the photocathode and the mesh. Moreover, when the scanning speed is increasing, the spatial resolution would increase, while the temporal resolution decreases. And also, there is best distance between the deflection plate and the photocathode which is of 100 mm, makes the better spatial resolution. The simulation results show that the static spatial resolution is higher than 25 lp/mm @ MTF=10%. While Tscreen is 0.5 ns, the dynamic spatial resolution is higher than 16 lp/mm @ MTF=10% and the temporal resolution is better than 5.6 ps. The experiment results show that the MTF of the streak tube is 35 lp/mm @ MTF=19% in the center of the photocathode and the static spatial resolution is 25 lp/mm @ CTF=13%. The PRS of the photocathode can reach 51 mA/W @ 400 nm.
References
[1] A FINCH, W E SLEAT, W SIBBETT. Subpicosecond synchroscan operation of a photochron IV streak camera. Review of Scientific Instruments, 60, 839-844(1989).
[2] J R TAYLOR, M C ADAMS, W SIBBETT. Investigation of viscosity dependent fluorescence lifetime using a synchronously operated picosecond streak camera. Applied Physics, 21, 13-17(1980).
[3] K KINOSHITA, Y INAGAKI, Y ISHIHARA et al. Femtosecond synchroscan streak tube. Japanese Journal of Applied Physics, 41, 389-392(2002).
[4] M C ADAMS, W SIBBETT, D J BRADLEY. Linear picosecond electron-optical chronoscopy at a repetition rate of 140 MHz. Optics Communications, 26, 273-276(1978).
[5] A TSIKOURAS, J NING et al. Streak camera crosstalk reduction using a multiple delay optical fiber bundle. Optics Letters, 37, 250-252(2012).
[6] Photochron 5 datasheet. http://www.photek.co.uk/products/datasheets.html
[7] W XIA, S HAN, N ULLAH et al. Design and modeling of three-dimensional laser imaging system based on streak tube. Applied Optics, 56, 487-497(2017).
[8] Liping TIAN, Jinshou TIAN, Wenlong WEN et al. Electro-optical design of a long slit streak tube(2017).
[9] Dandan HUI, Duan LUO, Liping TIAN et al. A compact large-format streak tube for imaging lidar. Review of Entific Instruments, 89, 045113(2018).
[10] Liping TIAN, Lili LI, Wenlong WEN et al. Numerical calculation and experimental study on the small-size streak tube. Acta Physica Sinica, 67, 188501(2018).
[11] Dandan HUI, Jinshou TIAN, Yu LU et al. Temporal distortion analysis of the streak tube. Acta Physica Sinica, 65, 158502(2016).
[13] Z Y HUA, C X GU. Electron optics, 237-246(1993).
[14] L V BAD’IN, S K DEMIN, S I SAFRONOV et al. Computer-aided designing of simple electron-optical systems for electron image tubes. Technical Physics, 56, 1167-1174(2011).


Set citation alerts for the article
Please enter your email address

© Copyright 2018-2021 | Chinese Laser Press. All Rights Reserved 沪ICP备15018463号-20