
Pai Peng, Zhilin Li, Xinbo Wang. Terahertz-Field-Induced Second Harmonic Generation in Weyl Semimetal TaAs[J]. Chinese Journal of Lasers, 2023, 50(17): 1714016
- Chinese Journal of Lasers
- Vol. 50, Issue 17, 1714016 (2023)
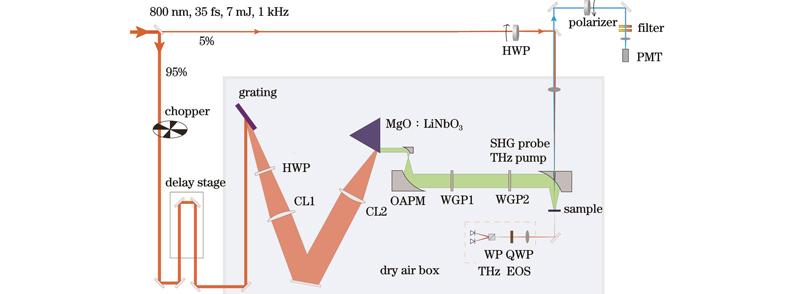
Fig. 1. Schematic diagram of the experimental setup, using wavefront tilt technology to generate strong electric field terahertz, and carrying electro-optic sampling and second harmonic generation detection at the sample position (grating: reflective diffraction grating, 1800 line/mm; HWP: half-wave plate; QWP: quarter-wave plate; CL: plano-convex cylindrical lens; MgO∶LiNbO3: magnesium oxide doped lithium niobate crystal; OAPM: off-axis parabolic mirror; WGP: terahertz wire grid polarizer; PMT: photomultiplier tube; WP:Wollaston prism; EOS:electro-optic sampling)
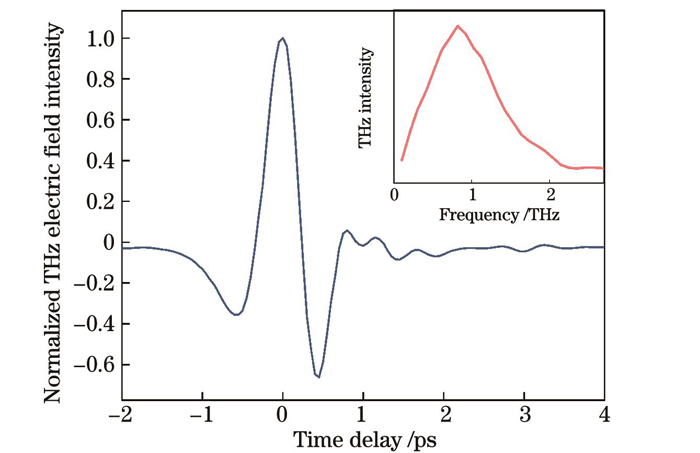
Fig. 2. Strong THz profiles generated by LiNbO3 crystal in time-domain and frequency-domain (inset)
Fig. 3. Image of the focused THz spot at sample position and the experimental and Gaussian fitting results of pixel-cutting along the horizontal and vertical directions through the center of the THz spot
Fig. 4. SHG intensity of TaAs (112) surface as a function of polarization angle under normal incidence
Fig. 5. Temporal profile of TFISHG signal (inset: TFISHG peak intensity as a funciton of THz electric field intensity along with a linear fit)
Fig. 6. Experimental results of TFISHG signals of the TaAs (112) surface under different measurement configurations at room temperature. TFISHG signal as a function of polarization angle when the intensity terahertz electric field is along the [1, 1, -1] direction (a) and [1, -1, 0] direction (b) of the sample where the incident polarization is either parallel or perpendicular to detection polarization. Hollow circles and solid lines represent the experimental data and the fitting results using formula (8)‒(13), respectively. (c) SHG intensity as a function of polarization angle measured under the same experimental condition except the THz pump beam is blocked. Solid circles and solid lines represent the experimental data and the fitting results using formula (5)‒(7), respectively. (d) The relative amplitude of the fitted third-order nonlinear susceptibility coefficient. Green and orange data are fitting results of (a) and (b), respectively

Set citation alerts for the article
Please enter your email address
© Copyright 2018-2021 | Chinese Laser Press. All Rights Reserved 沪ICP备15018463号-20