1Shanghai Key Laboratory of All Solid-State Laser and Applied Techniques, Shanghai Institute of Optics and Fine Mechanics, Chinese Academy of Sciences, Shanghai 201800, China
2University of Chinese Academy of Sciences, Beijing 100049, China
3Institute of Applied Physics and Computational Mathematics, Beijing 100088, China
4Key Laboratory of Science and Technology on High Energy Laser, CAEP, Mianyang 621900, China
Man Hu, Weiwei Ke, Yifeng Yang, Min Lei, Kai Liu, Xiaolong Chen, Chun Zhao, Yunfeng Qi, Bing He, Xiaojun Wang, Jun Zhou. Low threshold Raman effect in high power narrowband fiber amplifier[J]. Chinese Optics Letters, 2016, 14(1): 011901
Copy Citation Text
A low-threshold Raman effect in a kilowatt ytterbium-doped narrowband fiber amplifier system is reported. The Raman Stokes light at 1120 nm is achieved with the total output power of only , indicating that the Raman threshold of this kilowatt codirectional pumped continuous wave fiber amplifier is much lower than the predicted value estimated by the classic formula. To figure out the mechanism of this phenomenon, simulations based on the general stimulated Raman scattering (SRS) model are analyzed indicating that the key factor is the coupling between four-wave mixing (FWM) and SRS. The simulation results are in good agreement with our experiments.
Due to high efficiency, compactness, and excellent beam quality, fiber lasers have become one of the most popular laser technologies that are widely used in various scientific and industrial applications[1–3], such as material processing, remote sensing, free space communication, harmonic generation, medicine, and defense. Current state of continuous wave (CW) fiber laser systems based on master oscillator power amplifiers (MOPAs) emit several 10’s of kilowatts of output power with nearly diffraction-limited beam quality[4], but further improvement is limited by nonlinear effects, thermal effects, and modal instabilities. Specifically, for narrowband fiber lasers with typical linewidths of several 10’s of gigahertz, the most limiting of effects is the stimulated Raman scattering (SRS) because it normally presents the lowest onset threshold[5]. Once the threshold is reached, the SRS in fibers steadily transfers part of the signal energy into the undesirable Raman Stokes waves at longer wavelengths, and hence degrades the laser efficiency.
Generally speaking, for CW double-clad fiber lasers or amplifiers with subnanometer linewidth, the output laser power in the 20/400/0.06 fiber is estimated to be several kilowatts to exceeds the Raman threshold using the classic formula as defined in Ref. [6], where is the output power of the fiber laser that may induce considerable nonlinear power transferring, is the effective area of the laser wavelength in the fiber, is the peak value of the gain spectrum of the SRS effect, and is the effective nonlinear interaction length. By applying the parameters (1064 nm in 20/400/0.06 fiber), , , the calculated Raman threshold power is 2.8 kW. The recent new formula , with ( is the ratio between the Raman power and the signal at the output of the fiber at the threshold) proposed by Jauregui[7], where is the input signal power to the amplifier, is the attenuation factors of the fiber at the laser signal wavelengths, is a constant related to the doping ions, and is the fiber length, provides the Raman threshold of about 1.5 kW. To the best of our knowledge, SRS generated in a 20/400 ytterbium-doped narrowband fiber amplifier with only hundreds of watts has been scarcely reported.
The current study reports on the strong SRS effect observed in a 1.3 kW narrowband ytterbium-doped fiber amplifier (YDFA) system constructed with common 20/400/0.06 fiber. The Stokes band increases at a low power level of 400 W, which is sufficiently lower than the current theory prediction. This phenomenon is due to the coupling between four-wave mixing (FWM) and SRS. The coupling greatly enhances the Raman gain (RG). Such a Raman enhancement effect may lead to a significant improvement in obtaining low threshold, high power Raman fiber lasers.
Sign up for Chinese Optics Letters TOC. Get the latest issue of Chinese Optics Letters delivered right to you!Sign up now
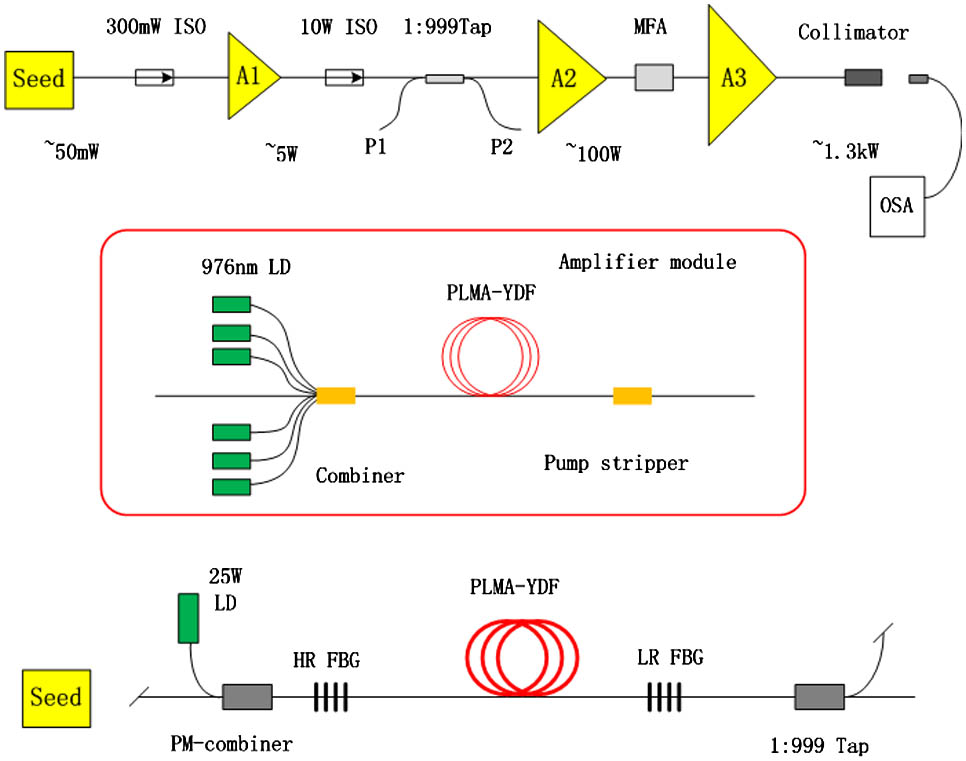
The experimental setup contains an all-fiber narrowband master oscillator (MO) seed source based on fiber Bragg gratings (FBGs) (called FBGs MO seed source) and a three-stage YDFA, which is shown in Fig. 1. The MO consists of a highly reflective (HR) FBG with more than 99% reflectivity and 0.18 nm bandwidth at 1064 nm, a lowly reflective (LR) FBG with 19% reflectivity and 0.07 nm bandwidth, and a 4 m 10/125 μm large-mode area (LMA) Yb-doped fiber (YDF) (Nufern, PLMA-YDF-10/125-VIII) with a 4.8 dB/m absorption at 975 nm. The MO seed outputs about 50 mW with a full width at half maximum (FWHM) of 70 pm. Then the seed laser is amplified from 50 mW to 5 W by A1 (stage 1), 5 W to 100 W by A2 (stage 2), and 100 W to 1.3 kW by A3 (stage 3). Stage 1 contains a 10 W 976 nm laser diode, a 10/125 μm PLMA-YDF, and a 10/125 μm combiner. Stage 2 consists of six 25 W 976 nm laser diodes and a 10/125 PLMA-YDF. Backward reflections can be avoided by polarization-maintaining (PM) isolators. A tapered fiber splitter (1:999) is spliced between A1 and A2 to detect the backscattered power of A3 from port 1 (P1). A mode field adaptor (MFA) with input fiber of 10/125 μm PLMA Ge-doped fiber (GDF) and output fiber of 20/400 μm LMA-GDF is set at the end of A2 to improve the mode coupling between A2 and A3. The gain fiber of A3 is 20/400/0.06 LMA non-PM YDF (Nufern, LMA-YDF-20/400-VIII). The output spectrum is measured by an optical spectrum analyzer (OSA, YOKOGAWA AQ6370) with a resolution of 20 pm. All three stages are co-pump operation.
Figure 1.Experimental arrangement of the 1.3 kW narrowband fiber amplifier.
The forward output spectra with respect to the output power are shown in Fig. 2(a). The clean spectra without any amplified spontaneous emission (ASE), Stokes, or anti-Stokes waves are seen clearly for the seed and the output of amplifier A1, as shown in the black and red lines, respectively. ASE light appears around 1080 nm (blue line) at 100 W, which is amplified by stage 2. Then both the signal laser and ASE light spread into the main amplifier A3. With the amplified output power reaching 400 W, a small spike around 1048 nm appears at the 1064 nm blueshift direction, which is symmetric with 1080 nm, shown in the green line. The Raman Stokes light at 1120 nm with a Raman shift of approximately 56 nm can also be observed at this power level. A new generated wavelength at 1024 nm appears at 820 W output power, corresponding to the anti-Raman Stokes light (pink line). Both Stokes and anti-Stokes powers increase notably with increasing output power. The quantitative increasing trends of the Raman Stokes and anti-Stokes powers, along with the output laser power, are shown in Fig. 2(b). According to the new Raman threshold calculation method in Ref. [7], the total output laser power at the Raman threshold is 820 W, which means that the Raman threshold of this kilowatt codirectional pumped CW fiber amplifier is times lower than the predicted value of 1.5 kW. When the total output laser power is amplified to 1.328 kW, the Raman Stokes power and the anti-Stokes power corresponds to 26 and 1.6 W, respectively.
Figure 2.(a) Output optical spectra of the 1.3 kW narrowband fiber amplifier under a wide scanning range; (b) power of the Raman Stokes and anti-Stokes lights versus the output laser power.
The output spectrum under a narrow scanning range of the 1.3 kW YDFA illustrates the spectral broadening of the signal laser. Figures 3(a) and 3(b) show the narrowband spectral profiles around the center wavelength and the FWHM linewidth at different output power levels, respectively. The FWHM of the seed increases from 70 to 130 pm after being amplified by A1 and A2. During the main amplifying process by A3, the FWHM keeps increasing from 130 to 688 pm, corresponding to the output laser power from 100 to 1310 W. The spectral broadening tendency exhibits a correlation with the square root of the output laser power, as depicted in Ref. [8]. The broadening mechanism is explained by the FWM process, which induces turbulent spectral broadening between oscillating longitudinal modes[9–11]. The theoretical spectral broadening curve is demonstrated in Fig. 3(b), as the red line shows, which is calculated using the modified square-root law suitable for high-power fiber lasers[8]. The calculated curve fits well with the experimental results either at medium power range (a few watts to a hundred watts) or at top high power to a kilowatt.
Figure 3.(a) Output optical spectra of the 1.3 kW narrowband fiber amplifier under a narrow scanning range; (b) FWHM of the signal laser under different output power.
Furthermore, the amplified signal laser is studied in the time domain to make sure there are no spikes and pulses in the amplitude that may result in high peak power to exceed the Raman threshold. The time-domain characteristic is monitored by a 6 GHz real-time oscilloscope (DPO 70604C, Tektronix) and a 15 GHz InGaAs photodetector (ET-3500, EOT), as shown in Fig. 4. It can be seen that the signal laser remains the time-domain characteristic of the seed source during the amplification process, except for the increased average amplitude value of the signal laser. No giant pulses are observed;just the stochastic background noise.
Figure 4.Signal laser in the time domain during the amplification process.
To clarify the mechanism of the advanced generation of the Raman Stokes light, simulations based on the general SRS model taking the coupling between FWM and SRS into consideration are analyzed. The power evolution of a wave at a given Stokes frequency in the fiber can be written as[7]where is the RG, is the effective area of the SRS effect, is the power distribution of the laser in fiber, is the distributed Raman noise[12], is the Stokes gain obtained from doping, and is the spontaneous emission induced by doping that may act as Stokes seeds. The laser power distribution can be calculated using the widely used amplifier model[13]. The undepleted pump assumption (UPA) is employed in calculating the Stokes power because is always satisfied in the whole fiber.
According to Refs. [14,15], the influence of the FWM on the SRS process manifests itself through a parametric effect that couples the pump and Stokes waves and that leads to the generation of the so-called anti-Stokes wave, which is located in the spectrum symmetrically to the Stokes wave with respect to the pump wave and, when the frequency vibration condition is matched, the anti-Stokes wave is coupled into the material excitation, which in turn affects the dynamics of the SRS. When the coupling between the FWM and the SRS exists, the normalized phase mismatch , where , , and are the propagation constants of the laser, Stokes wave, and anti-Stokes wave, is the most important parameter that determines the variation tendency of the RG. For a given , and is the conventional SRS gain of the Stokes wave, so the generated Stokes and anti-Stokes waves experience an enhanced effective gain where is the fractional contribution of Raman susceptibility to the instantaneous Kerr effect and is the peak value of the complex Raman susceptibility. The relationship expressed by Eq. (2) is shown in Fig. 5. A maximum enhancement factor of 3.3 is possible for a proper , which means that the RG can be increased or reduced depending on the value of . The Stokes output power calculated with different RG peak values is shown in Fig. 6. For the RG without any enhancement (), the Stokes output power is merely 0.5 W even for a laser output power of 1.3 kW, much lower than the experimental value of 26 W. The Stokes output power increases rapidly with the increasing RG peak value. It can be seen that, when a 2-time enhancement for RG is introduced, the calculation results are coincident with the experiment results for a laser power below 1 kW. For a laser power higher than 1 kW, a lower RG peak value is sufficient to fit the experiment results; however, a more than 1.5-time enhancement is still required. Therefore, we can deem that the calculated average RG peak value of about agrees well with our experiment result.
Figure 5.Effective gain enhancement factor along with the normalized phase mismatch .
Noticeably, the absolute phase mismatch is determined by the fiber and the chosen wavelengths. The laser power () varies at different longitudinal locations of the active fiber. Therefore, the normalized phase mismatch and the gain enhancement factor change along the fiber and the pump level. Figure 7 shows the changes in the gain enhancement factor along the fiber at different laser powers and six phase mismatch values of 0.5/m, 0.75/m, 1/m, 2/m, 3/m, and 4/m. The above -time RG enhancement factor indicates that the phase mismatch value is about 0.5/m in our fiber amplifier system.
Figure 7.Stokes gain enhancement factor at different laser powers and absolute phase mismatch values.
Although the quantitative power (power summation in the spectrum range) of the Stokes and anti-Stokes waves are not calculated in this study, the ratio of the anti-Stokes and Stokes powers at the RG peak can be calculated and the results are shown in Fig. 8. The results show that the power ratio increased along with laser power, indicating the increase in the anti-Stokes wave. Furthermore, considering that the value is 0.5/m as shown in the dark blue line, the ratio is approximately 6% when the laser output power is amplified to 1.3 kW, indicating a difference between the Stokes and anti-Stokes peaks, as confirmed by the experiment shown in Fig. 2(a).
Figure 8.Ratio of anti-Stokes and Stokes power at the RG peak along with laser output power and phase mismatch values.
The theoretical analysis indicates that the coupling between the FWM and SRS contributes an RG enhancement factor resulting in the low Raman threshold. The phase mismatch factor is the key parameter determining the gain enhancement factor and the increasing trend of the Raman Stokes power. Otherwise, by controlling the dispersion of the amplifying medium, the RG can be either enhanced or suppressed. For fibers with a small dispersion, smaller phase matching results in a lower SRS gain coefficient; at the condition of complete phase matching, it is even equal to zero. Thus, SRS suppression can be realized. For Raman fiber amplifiers and cascaded Raman fiber lasers with a proper phase mismatch value, the Raman enhancement effect is an important process used to boost the performances beyond the limits imposed by the magnitude of their intrinsic RG.
In conclusion, the low-threshold Raman effect in a kilowatt narrowband YDFA system is experimentally and numerically demonstrated. The Raman Stokes line is observed with the total output power of just 400 W. When the total output power reaches 1.3 kW, the Raman Stokes and anti-Stokes power is 26 and 1.6 W, respectively. The simulation results indicate that the -time enhanced SRS is caused by the coupling between the FWM and the SRS. By properly choosing the dispersion value of the main amplifier fibers, the SRS can be suppressed effectively, in theory. These new insights on the Raman enhancement process and generation mechanism in high-power narrowband fiber amplifiers are crucial for obtaining high-power low-threshold SRS or effectively suppressing the SRS.
Man Hu, Weiwei Ke, Yifeng Yang, Min Lei, Kai Liu, Xiaolong Chen, Chun Zhao, Yunfeng Qi, Bing He, Xiaojun Wang, Jun Zhou. Low threshold Raman effect in high power narrowband fiber amplifier[J]. Chinese Optics Letters, 2016, 14(1): 011901