• Journal of Geo-information Science
  • Vol. 22, Issue 3, 431 (2020)
Xue LEI, Yi ZHOU*, Yang LI, and Zetao WANG
Author Affiliations
  • School of Geography Science and Tourism, Shaanxi Normal University, Xi'an 710119, China
  • show less
    DOI: 10.12082/dqxxkx.2020.190495 Cite this Article
    Xue LEI, Yi ZHOU, Yang LI, Zetao WANG. Establishment and Feature Analysis of Loess Geomorphology Proximity Indexes based on DEM[J]. Journal of Geo-information Science, 2020, 22(3): 431 Copy Citation Text show less
    Location of 42 study areas in the Loess Plateau of northern Shaanxi
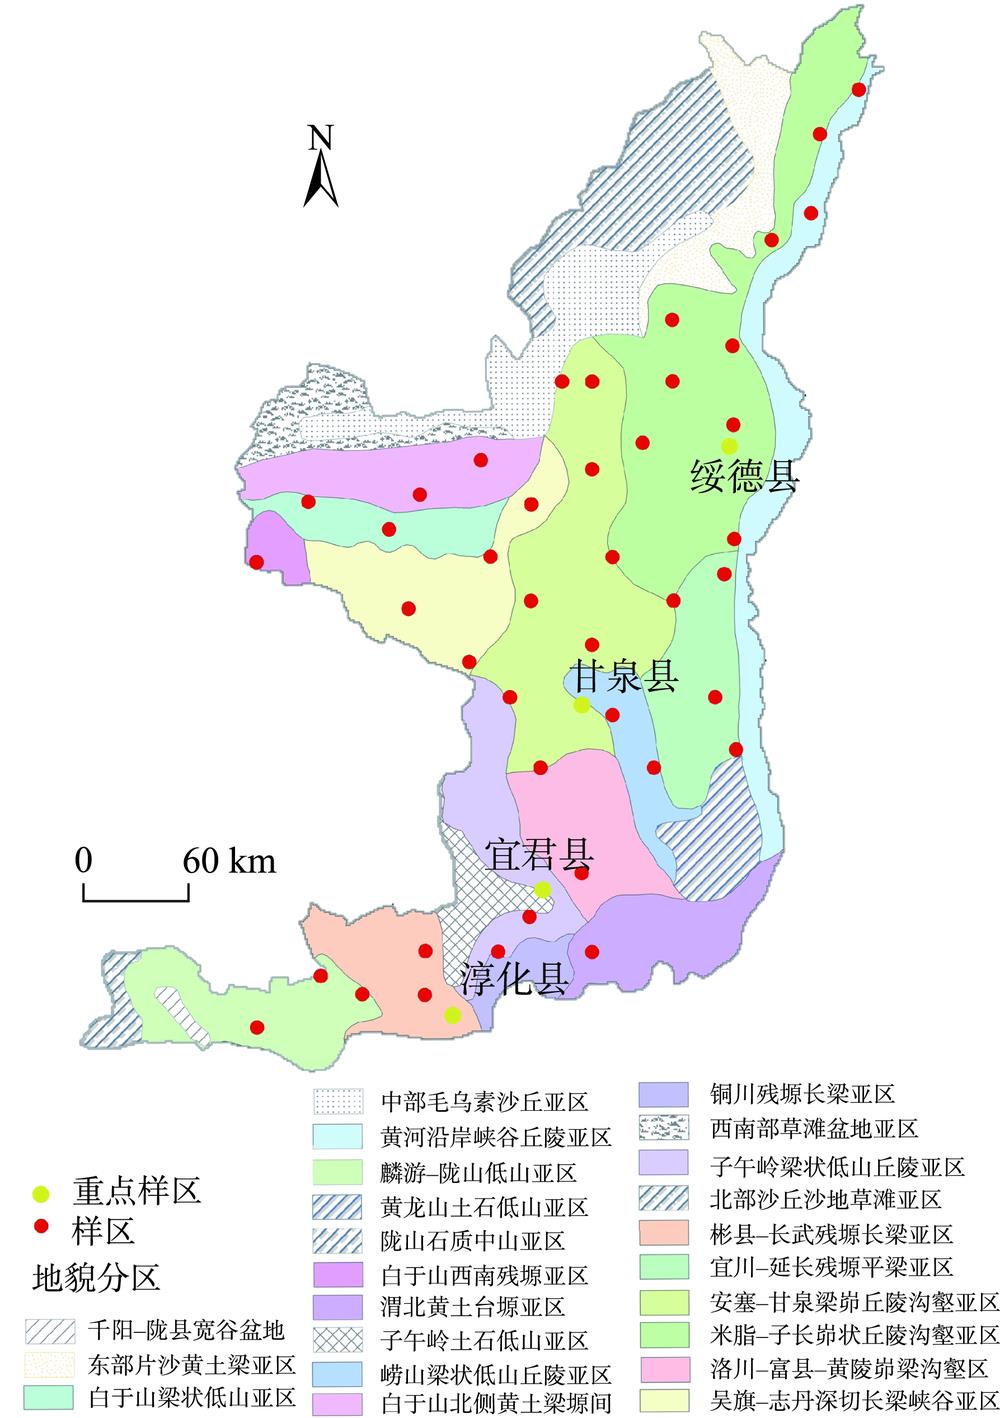
    Fig. 1. Location of 42 study areas in the Loess Plateau of northern Shaanxi
    Convergence network and gully network feature points and lines spatial distribution
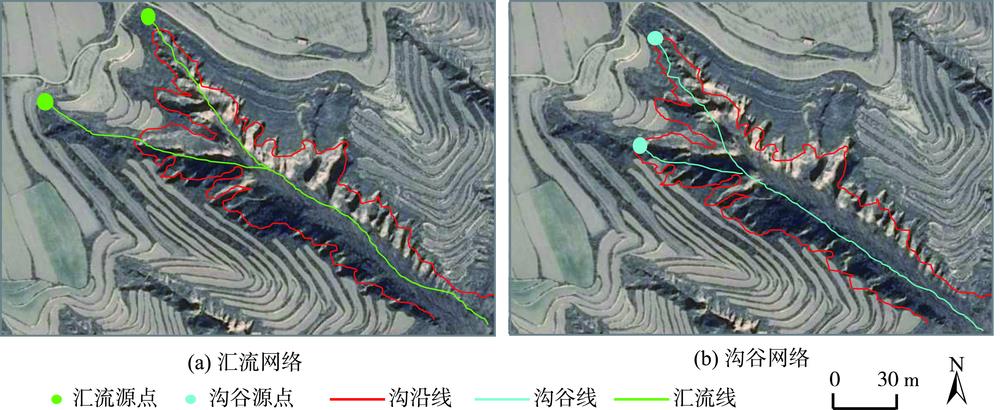
    Fig. 2. Convergence network and gully network feature points and lines spatial distribution
    Extraction results of feature points and lines by hydrologic analysis of Nantaizi watershed in Huangling county
    Fig. 3. Extraction results of feature points and lines by hydrologic analysis of Nantaizi watershed in Huangling county
    Schematic map of horizontal and vertical proximity indexs
    Fig. 4. Schematic map of horizontal and vertical proximity indexs
    Comparison map of proximity index and proximity distance
    Fig. 5. Comparison map of proximity index and proximity distance
    Watershed structure model map[31]
    Fig. 6. Watershed structure model map[31]
    Watershed classification map of Yijun
    Fig. 7. Watershed classification map of Yijun
    Proximity index of external confluence region on watershed scale of four key study areas
    Fig. 8. Proximity index of external confluence region on watershed scale of four key study areas
    Spatial differentiation of MHPI and MVPI in the Loess Plateau of northern Shaanxi
    Fig. 9. Spatial differentiation of MHPI and MVPI in the Loess Plateau of northern Shaanxi
    Comparison of MHPI and MVPI in the external confluence of the four key sample areas on the Loess Plateau of northern shaanxi
    Fig. 10. Comparison of MHPI and MVPI in the external confluence of the four key sample areas on the Loess Plateau of northern shaanxi
    Mean proximity index variability map of external confluence areas in four key study areas of the Loess Plateau of northern shaanxi
    Fig. 11. Mean proximity index variability map of external confluence areas in four key study areas of the Loess Plateau of northern shaanxi
    县城地貌类型纬度/ °面积/km2平均坡度/ °相对高差/m
    淳化黄土塬34.8837.9014.33545
    宜君黄土残塬35.1319.3719.49335
    甘泉黄土梁状丘陵沟壑区36.2119.3426.15282
    绥德黄土峁状丘陵沟壑区37.5812.3529.27320
    Table 1. Key sample areas basic information
    县城平均水平逼近度平均垂直逼近度沟谷密度/(km/km2蚕食度面积高程积分平均坡度/o面积/km2
    淳化0.550.602.760.210.6514.3337.90
    宜君0.570.544.640.430.5919.4919.37
    甘泉0.630.527.260.730.5026.1519.34
    绥德0.650.4610.460.800.4529.2712.35
    Table 2. Geomorphologic development index values in for key study areas of the Loess Plateau of northern shaanxi
    Xue LEI, Yi ZHOU, Yang LI, Zetao WANG. Establishment and Feature Analysis of Loess Geomorphology Proximity Indexes based on DEM[J]. Journal of Geo-information Science, 2020, 22(3): 431
    Download Citation