• Acta Physica Sinica
  • Vol. 69, Issue 10, 108701-1 (2020)
Cheng Xu1, Zhao Lin1, Kai Yang1、2、*, and Bing Yuan1、2、*
Author Affiliations
  • 1Center for Soft Condensed Matter Physics and Interdisciplinary Research, Soochow University, Suzhou 215006, China
  • 2School of Physical Science and Technology, Soochow University, Suzhou 215006, China
  • show less
    DOI: 10.7498/aps.69.20200166 Cite this Article
    Cheng Xu, Zhao Lin, Kai Yang, Bing Yuan. Single molecular kinetics during the interactions between melittin and a bi-component lipid membrane[J]. Acta Physica Sinica, 2020, 69(10): 108701-1 Copy Citation Text show less
    The sequence and α-helical structure of melittin
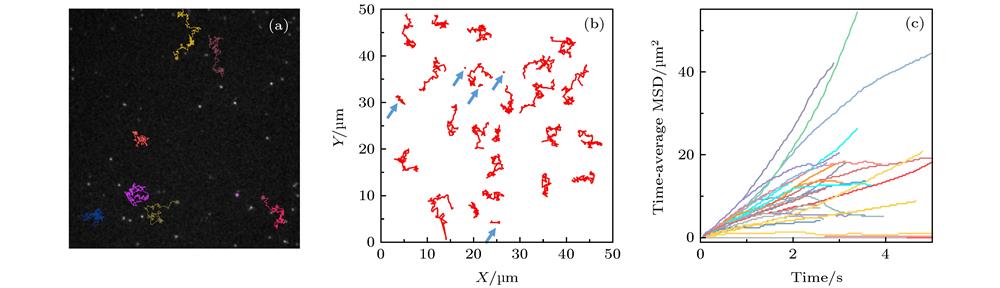
    Fig. 1. The sequence and α-helical structure of melittin
    Diffusion of lipids on a DOPC/DPPC membrane under the action of melittin at 0.5 µg/mL: (a) Microscopy image with some trajectories marked in colors; (b) typical lipid trajectories in 3 s; Some of the immobile ones are marked with blue arrows; (c) representative time-averaged MSD of lipids.
    Fig. 1. Diffusion of lipids on a DOPC/DPPC membrane under the action of melittin at 0.5 µg/mL: (a) Microscopy image with some trajectories marked in colors; (b) typical lipid trajectories in 3 s; Some of the immobile ones are marked with blue arrows; (c) representative time-averaged MSD of lipids.
    A2. Molecular structure of DOPC, DPPC and Rh-PE
    Fig. 2. A2. Molecular structure of DOPC, DPPC and Rh-PE
    PDF distribution of lipid diffusion coefficients (DL) of membrane with different melittin concentrations: (a) Histograms andfittings of the PDF; (b) corresponding peak locations and area proportionsin (a). Sample numbers are 657 (pristine membrane), 427 (with Mel at 0.5 µg/mL) and 507 (with Mel at 5.0 µg/mL), respectively.
    Fig. 2. PDF distribution of lipid diffusion coefficients (DL) of membrane with different melittin concentrations: (a) Histograms andfittings of the PDF; (b) corresponding peak locations and area proportionsin (a). Sample numbers are 657 (pristine membrane), 427 (with Mel at 0.5 µg/mL) and 507 (with Mel at 5.0 µg/mL), respectively.
    Three different types of lipid diffusion modes and their PDFs in three conditions of membrane without or with melittin exposure. Representative trajectories are shown on the right.
    Fig. 3. Three different types of lipid diffusion modes and their PDFs in three conditions of membrane without or with melittin exposure. Representative trajectories are shown on the right.
    Confocal images of calcein-encapsulated GUVs exposed to melittin at 0.5 or 5.0 µg/mL. The images were taken in the green (calcein), red (lipid) and overlaid channels. Cartoons on the right refer to the corresponding action states of peptides, including surface adsorption and transmembrane insertion
    Fig. 3. Confocal images of calcein-encapsulated GUVs exposed to melittin at 0.5 or 5.0 µg/mL. The images were taken in the green (calcein), red (lipid) and overlaid channels. Cartoons on the right refer to the corresponding action states of peptides, including surface adsorption and transmembrane insertion
    PDF of lipids in a pure DOPC bilayer. The data were obtained from three times of independently repeated tests, with a sample number of 404. Peak of the fitted curve locates at 2.780 µm2/s
    Fig. 4. PDF of lipids in a pure DOPC bilayer. The data were obtained from three times of independently repeated tests, with a sample number of 404. Peak of the fitted curve locates at 2.780 µm2/s
    Interaction between melittin and a phase-separated bilayer: (a) Snapshots showing the melittin-inducedporeformation process. Top: top view, bottom: side view. Red: melittin, blue: DPPC headgroup, green: DUPC headgroup. For clarity, lipid tails are not shown; (b) interaction details between Mel (red) and the surrounding lipids. Color codes are the same as in (a), with tails of the surrounding lipids in yellow, and heads of lipids away from the peptides in grey; (c) time evolution of phase boundary length (L) before and after the addition of melittin at P/L = 12/512. The time points of (a) are marked correspondingly in (c).
    Fig. 4. Interaction between melittin and a phase-separated bilayer: (a) Snapshots showing the melittin-inducedporeformation process. Top: top view, bottom: side view. Red: melittin, blue: DPPC headgroup, green: DUPC headgroup. For clarity, lipid tails are not shown; (b) interaction details between Mel (red) and the surrounding lipids. Color codes are the same as in (a), with tails of the surrounding lipids in yellow, and heads of lipids away from the peptides in grey; (c) time evolution of phase boundary length (L) before and after the addition of melittin at P/L = 12/512. The time points of (a) are marked correspondingly in (c).
    Example of lipid trajectories handled by wavelet: (a) X-coordinate profile of the original trajectory;(b) wavelet coefficients from the 2 nd to the 64 th
    Fig. 5. Example of lipid trajectories handled by wavelet: (a) X-coordinate profile of the original trajectory;(b) wavelet coefficients from the 2 nd to the 64 th
    The wavelet coefficients of the 2 nd, 32 th and 64 th scale; (d) the 32 th wavelet coefficient and the corresponding red line of threshold value
    Fig. 6. The wavelet coefficients of the 2 nd, 32 th and 64 th scale; (d) the 32 th wavelet coefficient and the corresponding red line of threshold value
    (a) Trajectory discriminated by wavelet using the 32 th scale coefficient, whose red part refers to the “fast” motion type and blue part refers to the “slow” motion type;(b)the corresponding MSD distributions of the red and blue parts.
    Fig. 7. (a) Trajectory discriminated by wavelet using the 32 th scale coefficient, whose red part refers to the “fast” motion type and blue part refers to the “slow” motion type;(b)the corresponding MSD distributions of the red and blue parts.
    Changes in MSD distributions of lipids before and after the addition of Mel in the simulations
    Fig. 8. Changes in MSD distributions of lipids before and after the addition of Mel in the simulations
    Cheng Xu, Zhao Lin, Kai Yang, Bing Yuan. Single molecular kinetics during the interactions between melittin and a bi-component lipid membrane[J]. Acta Physica Sinica, 2020, 69(10): 108701-1
    Download Citation