• Journal of Geo-information Science
  • Vol. 22, Issue 3, 605 (2020)
Jiafeng WANG1、1, Rong WANG2、2, Yongjiu FENG1、1、*, Zhenkun LEI2、2, Chen GAO2、2, Shurui CHEN2、2, Yanmin JIN1、1, and Shuting ZHAI2、2
Author Affiliations
  • 1College of Surveying and Geo-Informatics, Tongji University, Shanghai 200092, China
  • 1同济大学测绘与地理信息学院,上海 200092
  • 2College of Marine Sciences, Shanghai Ocean University, Shanghai 201306, China
  • 2上海海洋大学海洋科学学院,上海 201306
  • show less
    DOI: 10.12082/dqxxkx.2020.190305 Cite this Article
    Jiafeng WANG, Rong WANG, Yongjiu FENG, Zhenkun LEI, Chen GAO, Shurui CHEN, Yanmin JIN, Shuting ZHAI. Simulating Land Use Patterns of the Mid-Zhejiang Urban Agglomeration Considering the Effects of Urban Rail Transit[J]. Journal of Geo-information Science, 2020, 22(3): 605 Copy Citation Text show less
    Study area: location, administrative boundaries and planned urban rail transit sites
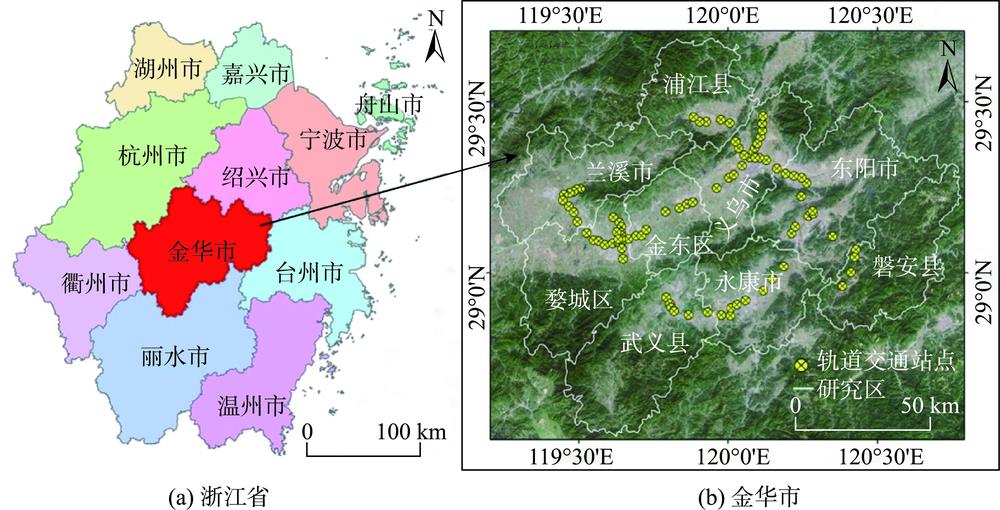
    Fig. 1. Study area: location, administrative boundaries and planned urban rail transit sites
    Land use patternsof the Mid-Zhejiang Urban Agglomeration derived from GlobeLand30 in 2000 and 2010
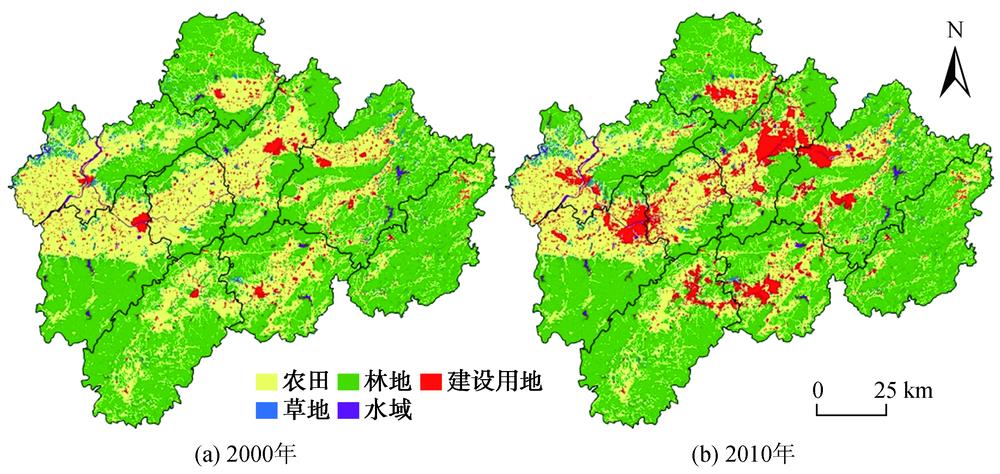
    Fig. 2. Land use patternsof the Mid-Zhejiang Urban Agglomeration derived from GlobeLand30 in 2000 and 2010
    Spatially visualized driving factors of land use change from 2000 to 2010
    Fig. 3. Spatially visualized driving factors of land use change from 2000 to 2010
    Comparison of the actual and simulated land use patterns in 2010
    Fig. 4. Comparison of the actual and simulated land use patterns in 2010
    Land use transition probabilities andtheir statistics under the two scenarios
    Fig. 5. Land use transition probabilities andtheir statistics under the two scenarios
    The Land use patterns of theMid-Zhejiang urban agglomeration in 2030
    Fig. 6. The Land use patterns of theMid-Zhejiang urban agglomeration in 2030
    5-km based buffers centered at the rail transit sites
    Fig. 7. 5-km based buffers centered at the rail transit sites
    类型2010年
    农田林地草地水域建设用地总计
    2000年农田3479.41167.6838.0118.75514.064217.91
    林地135.875506.24130.8412.099.665794.70
    草地61.53118.18296.801.345.73483.59
    水域17.648.550.76129.023.59159.57
    建设用地25.271.230.640.99262.05290.19
    总计3719.735801.88467.06162.20795.0910 945.96
    Table 1. Land use transition matrix of the Mid-Zhejiang Urban Agglomeration from 2000 to 2010 (km2)
    类别变量简称分辨率/m年份意义来源
    地形高程DEM302009评估地形要素对土地利用的影响www.gscloud.cn
    坡度Slope302009计算高程数据的坡度
    社会经济人口POP902015评估社会经济要素对土地利用的影响www.worldpop.org
    经济GDP9002010www.ngdc.noaa.gov
    区位到市中心的距离DisCity302010行政中心邻近度对土地利用的影响ArcGIS计算对应矢量数据的欧氏距离。矢量数据来源:www.openstreetmap.org
    到区中心的距离DisCounty30
    交通到主干道的距离DisRoad30道路邻近度对土地利用的影响
    到轨道交通的距离DisRail30
    Table 2. The spatial driving factors of land use change
    类型2010年真实
    农田林地草地水域建设用地总计
    2010年模拟农田329.4118.0811.751.7410.24371.22
    林地14.05550.9113.611.210.93580.71
    草地14.7910.7321.010.120.3046.95
    水域2.000.900.1012.900.3916.29
    建设用地11.280.250.250.3067.3579.43
    总计371.53580.8746.7216.2779.211094.60
    总体精度/%89.74
    Kappa /%82.69
    FOM/%29.86
    Table 3. Errormatrix and accuracyassessment of land use simulation in 2010 (km2)
    景观指数常规情景轨交情景
    农田林地草地水域建设用地农田林地草地水域建设用地
    LPI6.6714.480.020.293.564.7415.940.020.293.54
    PAFRAC1.441.471.551.471.371.551.541.621.471.37
    DIVISION0.990.951.001.001.001.000.941.001.001.00
    IJI84.8564.5248.4280.2441.1880.5961.3751.4581.5842.81
    PLADJ89.8994.2552.0577.6393.2587.5593.0545.0077.8293.66
    AI89.9494.2952.1277.8193.3287.6093.0845.0678.0193.73
    CLUMPY0.860.880.500.770.920.830.850.430.780.93
    COHESION99.6599.9084.7797.1299.4999.5999.9185.0397.0999.52
    Table 4. Landscape metrics of the two predicted land use scenarios
    Jiafeng WANG, Rong WANG, Yongjiu FENG, Zhenkun LEI, Chen GAO, Shurui CHEN, Yanmin JIN, Shuting ZHAI. Simulating Land Use Patterns of the Mid-Zhejiang Urban Agglomeration Considering the Effects of Urban Rail Transit[J]. Journal of Geo-information Science, 2020, 22(3): 605
    Download Citation