Author Affiliations
1College of Mechanical Engineering and Mechanics, Ningbo University, Ningbo, Zhejiang 315211, China2Ningbo Institute of Materials Technology and Engineering, Chinese Academy of Sciences, Ningbo, Zhejiang 315201, Chinashow less
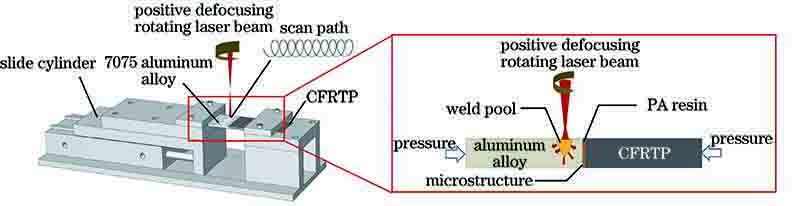
Fig. 1. Schematic of welding fixture and welding principle
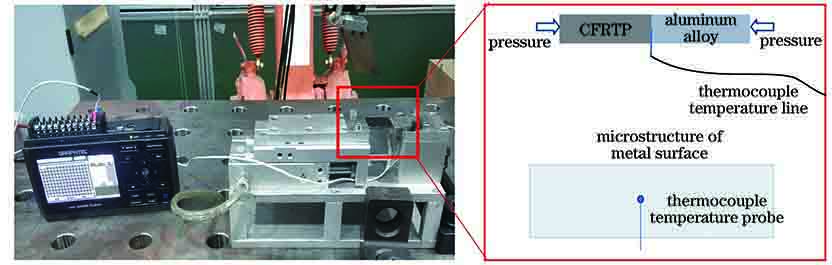
Fig. 4. Temperature measuring device and method
Fig. 5. Tensile strength obtained in each experimental group
Fig. 6. Schematic of samples. (a) Failed welding sample; (b) successful welding sample
Fig. 7. Surface appearance of sample A joint after fracture. (a) Aluminum alloy surface; (b) composite surface
Fig. 8. Surface appearance of sample B joint after fracture. (a) Aluminum alloy surface; (b) composite surface
Fig. 9. Surface appearance of sample C joint after fracture. (a) Aluminum alloy surface; (b) composite surface
Fig. 10. Surface appearance of sample D joint after fracture. (a) Aluminum alloy surface; (b) composite surface
Fig. 11. Measured joint temperature during welding process
Material | Density /(kg·m-3) | Specific heat /(J·Kg-1·℃-1) | Thermal conductivity /(W·m-1·℃-1) | Melting point /℃ | Decompositiontemperature /℃ |
---|
PA | 1150 | 2500 | 0.25 | 215--225 | 330 | T700 | 1760 | 712 | 6.5 | 3000 | | 7075-T6 | 2800 | 860--1320 | 130 | 475--635 | |
|
Table 1. Thermophysical parameters of materials
Level | Factor |
---|
Laser powerP /W | Welding speedv /(mm·s-1) | Stirring amplitudeΦ /mm | Stirring frequencyf /Hz | Clamp pressureP /MPa | Defocusing amountd /mm |
---|
1 | 250 | 2 | 0.6 | 10 | 0.1 | 25 | 2 | 300 | 4 | 0.8 | 20 | 0.2 | 30 | 3 | 350 | 6 | 1.0 | 30 | 0.3 | 35 | 4 | 400 | 8 | 1.2 | 40 | 0.4 | 40 | 5 | 450 | 10 | 1.4 | 50 | 0.5 | 45 |
|
Table 2. Configuration of experiment parameters
Number | Laser powerP /W | Welding speedv /(mm·s-1) | Stirringamplitude Φ /mm | Stirring frequencyf /Hz | Clamp pressureP /MPa | Defocusingamount d /mm |
---|
1 | 250 | 2 | 0.6 | 10 | 0.1 | 25 | 2 | 250 | 4 | 0.8 | 20 | 0.2 | 30 | 3 | 250 | 6 | 1.0 | 30 | 0.3 | 35 | 4 | 250 | 8 | 1.2 | 40 | 0.4 | 40 | 5 | 250 | 10 | 1.4 | 50 | 0.5 | 45 | 6 | 300 | 2 | 0.8 | 30 | 0.4 | 45 | 7(A) | 300 | 4 | 1.0 | 40 | 0.5 | 25 | 8 | 300 | 6 | 1.2 | 50 | 0.1 | 30 | 9(D) | 300 | 8 | 1.4 | 10 | 0.2 | 35 | 10 | 300 | 10 | 0.6 | 20 | 0.3 | 40 | 11 | 350 | 2 | 1.0 | 50 | 0.2 | 40 | 12 | 350 | 4 | 1.2 | 10 | 0.3 | 45 | 13 | 350 | 6 | 1.4 | 20 | 0.4 | 25 | 14(B) | 350 | 8 | 0.6 | 30 | 0.5 | 30 | 15 | 350 | 10 | 0.8 | 40 | 0.1 | 35 | 16 | 400 | 2 | 1.2 | 20 | 0.5 | 35 | 17(C) | 400 | 4 | 1.4 | 30 | 0.1 | 40 | 18 | 400 | 6 | 0.6 | 40 | 0.2 | 45 | 19 | 400 | 8 | 0.8 | 50 | 0.3 | 25 | 20 | 400 | 10 | 1.0 | 10 | 0.4 | 30 | 21 | 450 | 2 | 1.4 | 40 | 0.3 | 30 | 22 | 450 | 4 | 0.6 | 50 | 0.4 | 35 | 23 | 450 | 6 | 0.8 | 10 | 0.5 | 40 | 24 | 450 | 8 | 1.0 | 20 | 0.1 | 45 | 25 | 450 | 10 | 1.2 | 30 | 0.2 | 25 |
|
Table 3. Orthogonal experimental design
Range | Factor |
---|
Laser power | Weldingspeed | Stir theamplitude | The stirringfrequency | Clamp pressure | Defocusingamount |
---|
kJ1 | 248.96 | 79.70 | 336.56 | 280.78 | 256.62 | 351.82 | kJ2 | 228.58 | 339.54 | 157.54 | 157.26 | 239.36 | 237.08 | kJ3 | 267.50 | 211.72 | 243.18 | 240.02 | 256.40 | 95.06 | kJ4 | 330.44 | 331.68 | 242.98 | 326.62 | 153.06 | 174.94 | kJ5 | 80.46 | 193.30 | 175.68 | 151.26 | 250.50 | 297.04 | RJ | 249.98 | 259.84 | 179.02 | 175.36 | 103.56 | 256.76 | Rank | 3 | 1 | 4 | 5 | 6 | 2 |
|
Table 4. Range analysis of orthogonal experiment