• Chinese Journal of Lasers
  • Vol. 50, Issue 7, 0708005 (2023)
Xiaoyue Wang1、2、*, Haotian Shi1, Zijian Wang1, Bo Peng1, Ming Yan1、3, and Weiwei Liu3
Author Affiliations
  • 1State Key Laboratory of Precision Spectroscopy, East China Normal University, Shanghai 200062, China
  • 2College of Optical and Electronic Technology, China Jiliang University, Hangzhou 310018, Zhejiang, China
  • 3Institute of Modern Optics, Nankai University, Tianjin 300071, China
  • show less
    DOI: 10.3788/CJL221498 Cite this Article Set citation alerts
    Xiaoyue Wang, Haotian Shi, Zijian Wang, Bo Peng, Ming Yan, Weiwei Liu. Research on Detection Technology of Fluorescence Enhanced Spectroscopy Based on Counter-Propagating Filaments[J]. Chinese Journal of Lasers, 2023, 50(7): 0708005 Copy Citation Text show less
    Experimental setup for two collinear laser beams propagating in opposite directions
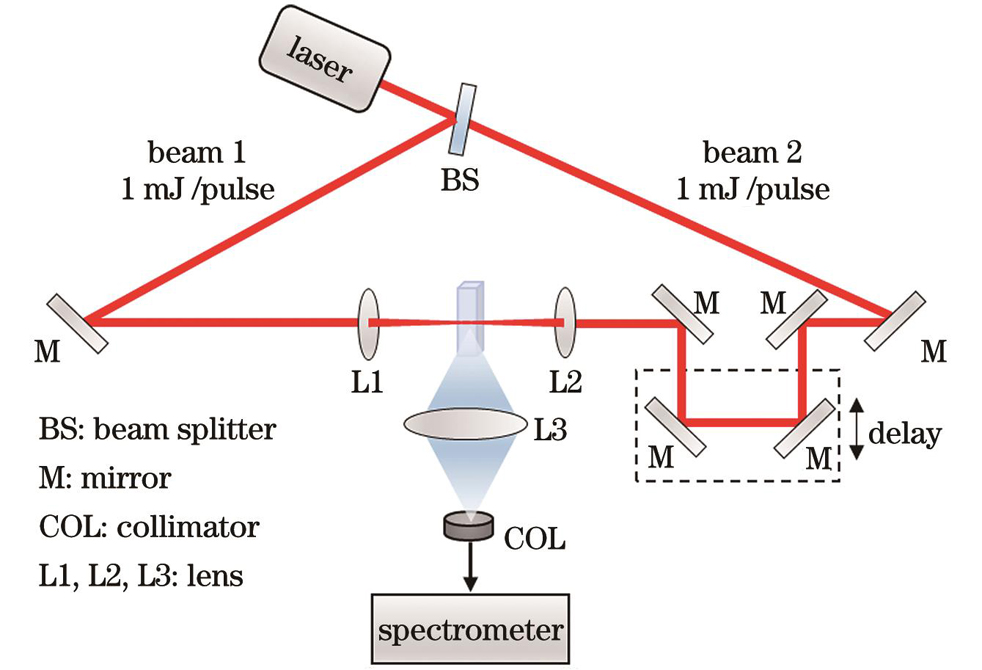
    Fig. 1. Experimental setup for two collinear laser beams propagating in opposite directions
    Comparison of fluorescence signals induced by collinear counter-propagating filaments and single laser filament. (a) Fluorescence spectra in which triangle represents peak value of fluorescence line; (b) intensity of filament induced fluorescence signal versus laser energy
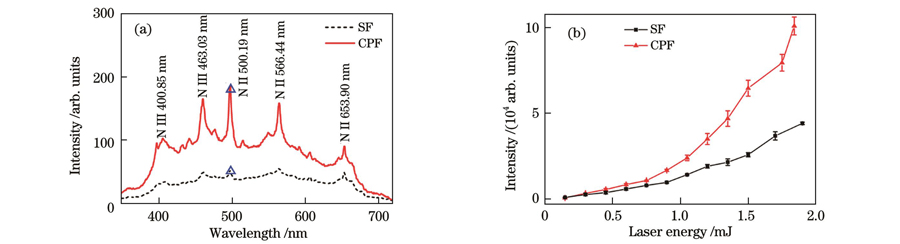
    Fig. 2. Comparison of fluorescence signals induced by collinear counter-propagating filaments and single laser filament. (a) Fluorescence spectra in which triangle represents peak value of fluorescence line; (b) intensity of filament induced fluorescence signal versus laser energy
    Attenuation time of filament induced fluorescence signals with different wavelengths. (a) 337 nm; (b) 427 nm; (c) 481 nm
    Fig. 3. Attenuation time of filament induced fluorescence signals with different wavelengths. (a) 337 nm; (b) 427 nm; (c) 481 nm
    Fluorescence signal intensity excited by CPF versus delay time. (a) Intensity of fluorescence signal versus delay time at 350-900 nm; (b) R at characteristic peaks of N III 400.85 nm (rectangle) and N II 500.19 nm (dot) versus delay time
    Fig. 4. Fluorescence signal intensity excited by CPF versus delay time. (a) Intensity of fluorescence signal versus delay time at 350-900 nm; (b) R at characteristic peaks of N III 400.85 nm (rectangle) and N II 500.19 nm (dot) versus delay time
    Fluorescence spectra when solution mass fraction is 2000×10-6. (a) KCl solution; (b) Na2SO4 solution; (c) MgSO4 solution
    Fig. 5. Fluorescence spectra when solution mass fraction is 2000×10-6. (a) KCl solution; (b) Na2SO4 solution; (c) MgSO4 solution
    Relationship between solution mass fraction and fluorescence intensity. (a) KCl solution; (b) Na2SO4 solution; (c) MgSO4 solution
    Fig. 6. Relationship between solution mass fraction and fluorescence intensity. (a) KCl solution; (b) Na2SO4 solution; (c) MgSO4 solution
    Xiaoyue Wang, Haotian Shi, Zijian Wang, Bo Peng, Ming Yan, Weiwei Liu. Research on Detection Technology of Fluorescence Enhanced Spectroscopy Based on Counter-Propagating Filaments[J]. Chinese Journal of Lasers, 2023, 50(7): 0708005
    Download Citation