Author Affiliations
1Key Laboratory for Urban Habitat Environmental Science and Technology, School of Urban Planning and Design, Shenzhen Graduate School of Peking University, Shenzhen 518055, Guangdong, China2Key Laboratory for Earth Surface Processes of Ministry of Education, College of Urban and Environmental Sciences, Peking University, Beijing 100871, Chinashow less
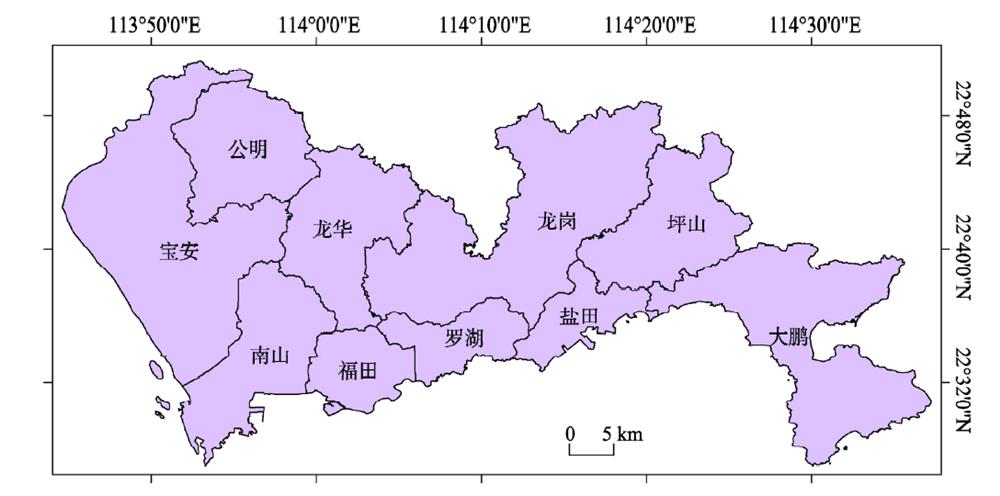
Fig. 1. Administrative division of Shenzhen
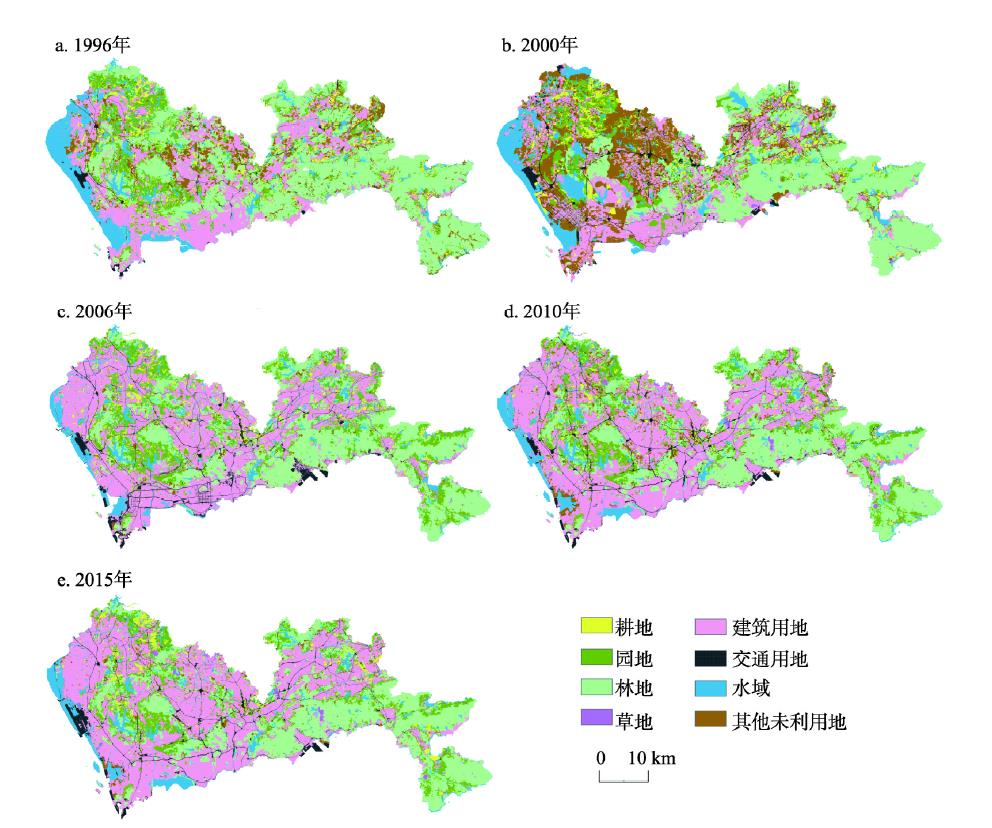
Fig. 2. Landscape of Shenzhen during 1996-2015
Fig. 3. Changes of landscape metrics in class level of Shenzhen during 1996-2015
Fig. 4. Changes of landscape metrics in landscape level of Shenzhen during 1996-2015
Fig. 5. The map of main landscape type transfer by stage during 1996-2010
Fig. 6. The process of urban expansion in Shenzhen during 1996-2015
| 景观格局指数 | 指标名称 | 指标意义 |
|---|
| CA | 斑块类型面积,单位:hm² | 反映景观中优势斑块类型。 | | PLAND | 斑块类型所占景观面积的比例,单位:% | 反映景观面积的比例 | | NP | 斑块个数,单位:个 | 反映景观异质性和破碎度。 | | PD | 斑块密度,单位:个/100 hm2 | 斑块数量特征,反映景观异质性和破碎度。PD值越大,表明景观斑块破碎度越大。 | | ED | 边缘密度,单位:m/hm² | 表征景观被边界分割的程度,ED值越大,表明斑块形状越复杂,景观被边界分割的程度越高。 | | AREA_MN | 平均斑块面积,单位:hm² | 表征景观的破碎化程度,值减小说明景观的破碎化程度上升,反之则下降。 | | AI | 聚集度指数 | 反映景观要素的聚集程度。AI的取值范围为[0, 100]。当AI接近于100时,斑块聚集越紧密,景观内部以少量大斑块为主或者斑块高度相连;当AI趋近于0时,景观中斑块离散程度越大,该类型景观由越多离散的小斑块组成。 | | PAFRAC | 周长面积分维数 | 反映形状的复杂性,其值范围为[1, 2],PAFRAC接近于1表明景观边界形状非常简单,如正方形,接近于2表明边界形状非常复杂。 | | SHDI | 香农多样性指数 | 体现景观水平复杂程度,斑块丰富度越大或不同斑块面积分布越均匀时,SHDI值越大。 | | SHEI | 香农均匀度指数 | 表征城市土地利用的均质性的强弱。SHEI取值范围为[0, 1],SHEI越接近1表明斑块类型分布越均匀,多样性越强;SHEI趋于0时,景观分布极不均匀,优势斑块控制度强。 |
|
Table 1. Landscape pattern index
| 变量类别 | 变量 | 单位 |
|---|
| 社会经济 | GDP密度 | 万元/km2 | | 人口密度 | 万人/km2 | | 土地政策 | 基本生态控制线 | - | | 自然条件 | 高程 | m | | 坡度 | ° | | 至水库、湖泊的距离 | m | | 至河流水系的距离 | m | | 可达性 | 至铁路、轻轨的距离 | m | | 至公路的距离 | m | | 局地邻近 | 距离居街道居委会距离 | m |
|
Table 2. Driving forces of urban landscape change in Shenzhen
| 景观类型 | CA(km²) | | PLAND(%) |
|---|
| 1996年 | 2000年 | 2006年 | 2010年 | 2015年 | 1996年 | 2000年 | 2006年 | 2010年 | 2015年 |
|---|
| 耕地 | 70.68 | 90.75 | 50.39 | 43.85 | 50.41 | | 3.61 | 4.63 | 2.54 | 2.20 | 2.51 | | 园地 | 221.19 | 185.22 | 269.73 | 236.83 | 207.86 | | 11.28 | 9.44 | 13.76 | 11.87 | 10.39 | | 林地 | 736.02 | 571.96 | 581.57 | 586.62 | 578.43 | | 37.52 | 29.03 | 29.68 | 29.41 | 28.92 | | 草地 | 4.16 | 5.33 | 10.26 | 32.88 | 25.03 | | 0.21 | 0.27 | 0.52 | 1.65 | 1.25 | | 建筑用地 | 502.55 | 461.54 | 774.37 | 752.35 | 828.70 | | 25.62 | 23.48 | 39.51 | 37.72 | 41.43 | | 交通用地 | 27.17 | 78.97 | 91.83 | 88.29 | 100.44 | | 1.39 | 4.02 | 4.69 | 4.43 | 5.02 | | 水域 | 230.64 | 226.82 | 172.56 | 167.56 | 157.64 | | 11.76 | 11.56 | 8.80 | 8.40 | 7.88 | | 其他未利用地 | 169.08 | 334 | 9.06 | 86.09 | 51.60 | | 8.62 | 17.02 | 0.46 | 4.32 | 2.58 |
|
Table 3. Changes of landscape area and proportion in Shenzhen during 1996-2015
| 时期 | 飞地式(km2) | 蔓延式(km2) | 填充式(km2) | 总计(km2) | 占比(%) |
|---|
| 1996—2000年 | 8.29 | 139.23 | 51.05 | 198.57 | 23.18 | | 2000—2006年 | 7.24 | 252.57 | 166.58 | 426.39 | 49.78 | | 2006—2010年 | 4.45 | 76.37 | 53.69 | 134.51 | 15.71 | | 2010—2015年 | 1.78 | 55.90 | 39.37 | 97.05 | 11.33 | | 总计 | 21.76 | 524.07 | 310.69 | 856.52 | 100.00 | | 占比(%) | 2.54 | 61.19 | 36.27 | 100.00 | |
|
Table 4. The area and proportion of different urban expansion modes during 1996-2015
| 深圳区 | | 宝安区 | | 大鹏新区 | | 福田区 | | 光明区 | | 龙岗区 | | 龙华区 | | 罗湖区 | | 南山区 | | 坪山区 | | 盐田区 |
|---|
| 系数 | P值 | 系数 | P值 | 系数 | P值 | 系数 | P值 | 系数 | P值 | 系数 | P值 | 系数 | P值 | 系数 | P值 | 系数 | P值 | 系数 | P值 | 系数 | P值 |
|---|
| 常数项 | 1.715262 | 0.000 | | -1.164249 | 0.143 | | 4.261677 | 0.051 | | -10.056060 | 0.262 | | 2.886854 | 0.010 | | 4.261600 | 0.000 | | 0.500071 | 0.677 | | 1.631017 | 0.551 | | 4.987378 | 0.001 | | -2.166807 | 0.244 | | 1.079330 | 0.864 | | GDP密度 | 0.000049 | 0.000 | 0.000128 | 0.000 | 0.000035 | 0.643 | -0.000276 | 0.258 | 0.000006 | 0.903 | 0.000006 | 0.722 | 0.000001 | 0.969 | 0.000030 | 0.827 | 0.000143 | 0.031 | 0.000091 | 0.024 | -0.000150 | 0.452 | | 人口密度 | 0.000652 | 0.096 | 0.002423 | 0.019 | 0.002319 | 0.446 | 0.021365 | 0.125 | 0.000822 | 0.671 | -0.001277 | 0.121 | 0.003953 | 0.002 | -0.005364 | 0.165 | -0.012242 | 0.000 | 0.002201 | 0.275 | 0.012548 | 0.075 | | 生态控制线 | -0.202301 | 0.000 | -0.139287 | 0.004 | 0.155235 | 0.201 | -0.592863 | 0.065 | -0.154320 | 0.006 | -0.265578 | 0.000 | -0.295552 | 0.000 | 0.187390 | 0.383 | -0.383631 | 0.001 | -0.134058 | 0.055 | -0.329009 | 0.481 | | 高程 | -0.007599 | 0.000 | -0.005788 | 0.007 | -0.023706 | 0.000 | -0.026796 | 0.204 | -0.006354 | 0.250 | -0.013953 | 0.000 | -0.011181 | 0.002 | -0.013120 | 0.003 | -0.020943 | 0.000 | -0.017451 | 0.000 | -0.025301 | 0.001 | | 坡度 | -0.123176 | 0.000 | -0.142193 | 0.000 | -0.059052 | 0.038 | -0.133312 | 0.171 | -0.157702 | 0.000 | -0.142611 | 0.000 | -0.093219 | 0.000 | -0.053011 | 0.108 | -0.097448 | 0.002 | -0.079402 | 0.003 | -0.134423 | 0.010 | | 至水库、湖泊距离 | 0.000002 | 0.769 | 0.000005 | 0.789 | -0.000304 | 0.001 | 0.000339 | 0.330 | -0.000099 | 0.005 | -0.000003 | 0.859 | -0.000019 | 0.663 | 0.000153 | 0.398 | 0.000194 | 0.046 | 0.000133 | 0.165 | 0.000527 | 0.074 | | 至河流水系距离 | -0.000018 | 0.392 | 0.000144 | 0.018 | -0.000416 | 0.001 | -0.000330 | 0.483 | -0.000126 | 0.155 | -0.000048 | 0.478 | 0.000241 | 0.025 | 0.001081 | 0.041 | -0.000068 | 0.641 | -0.000138 | 0.114 | -0.000285 | 0.563 | | 至铁路、轻轨距离 | -0.000053 | 0.000 | 0.000085 | 0.106 | -0.000090 | 0.021 | 0.001789 | 0.248 | -0.000095 | 0.187 | -0.000251 | 0.000 | -0.000031 | 0.613 | -0.001013 | 0.004 | -0.000033 | 0.851 | 0.000307 | 0.000 | -0.000375 | 0.359 | | 至公路距离 | -0.000151 | 0.000 | 0.000095 | 0.276 | -0.001015 | 0.001 | -0.001584 | 0.097 | -0.000449 | 0.000 | -0.000251 | 0.010 | -0.000239 | 0.217 | 0.000386 | 0.486 | -0.000024 | 0.880 | 0.000066 | 0.671 | 0.000696 | 0.219 | | 至街道居委会距离 | -0.031493 | 0.180 | 0.036157 | 0.507 | 0.253103 | 0.196 | -0.215321 | 0.622 | 0.077001 | 0.442 | -0.013348 | 0.801 | -0.073638 | 0.232 | 0.085024 | 0.735 | 0.107835 | 0.386 | 0.050566 | 0.613 | -1.060136 | 0.096 | | LRstatistic | 2449 | | 696 | | 310 | | 63 | | 257 | | 695 | | 328 | | 53 | | 241 | | 375 | | 88 | | | P值(LR-statistic) | 0.000 | | 0.000 | | 0.000 | | 0.000 | | 0.000 | | 0.000 | | 0.000 | | 0.000 | | 0.000 | | 0.000 | | 0.000 | | | ROC | 0.8449 | | 0.8481 | | 0.8472 | | 0.9135 | | 0.8438 | | 0.8253 | | 0.8091 | | 0.8114 | | 0.8590 | | 8.8612 | | 0.8664 | |
|
Table 5. Parameters and tests of Binary Logit regression models
| 变量 | 深圳区 | 宝安区 | 大鹏新区 | 福田区 | 光明区 | 龙岗区 | 龙华区 | 罗湖区 | 南山区 | 坪山区 | 盐田区 |
|---|
| GDP密度 | ★ | ★ | ○ | ○ | ○ | ○ | ○ | ○ | ★ | ★ | ○ | | 人口密度 | ★ | ★ | ○ | ○ | ○ | ○ | ★ | ○ | ☆ | ○ | ○ | | 生态控制线 | ☆ | ☆ | ○ | ☆ | ☆ | ☆ | ☆ | ○ | ☆ | ☆ | ★ | | 高程 | ☆ | ☆ | ☆ | ○ | ○ | ☆ | ☆ | ☆ | ☆ | ☆ | ☆ | | 坡度 | ☆ | ☆ | ☆ | ○ | ☆ | ☆ | ☆ | ○ | ☆ | ☆ | ☆ | | 至水库、湖泊距离 | ○ | ○ | ☆ | ○ | ☆ | ○ | ○ | ○ | ★ | ○ | ★ | | 至河流水系距离 | ○ | ★ | ☆ | ○ | ○ | ○ | ★ | ★ | ○ | ○ | ○ | | 至铁路、轻轨距离 | ☆ | ○ | ☆ | ○ | ○ | ☆ | ○ | ☆ | ○ | ★ | ○ | | 至公路距离 | ☆ | ○ | ☆ | ☆ | ☆ | ☆ | ○ | ○ | ○ | ○ | ○ | | 至街道居委会距离 | ○ | ○ | ☆ | ○ | ○ | ○ | ★ | ○ | ★ | ○ | ☆ |
|
Table 6. Driving forces of landscape evolution in Shenzhen and its districts