
Guanxue Wang, Yue Li, Xinzhi Shan, Yu Miao, Xiumin Gao. Hermite–Gaussian beams with sinusoidal vortex phase modulation[J]. Chinese Optics Letters, 2020, 18(4): 042601
- Chinese Optics Letters
- Vol. 18, Issue 4, 042601 (2020)
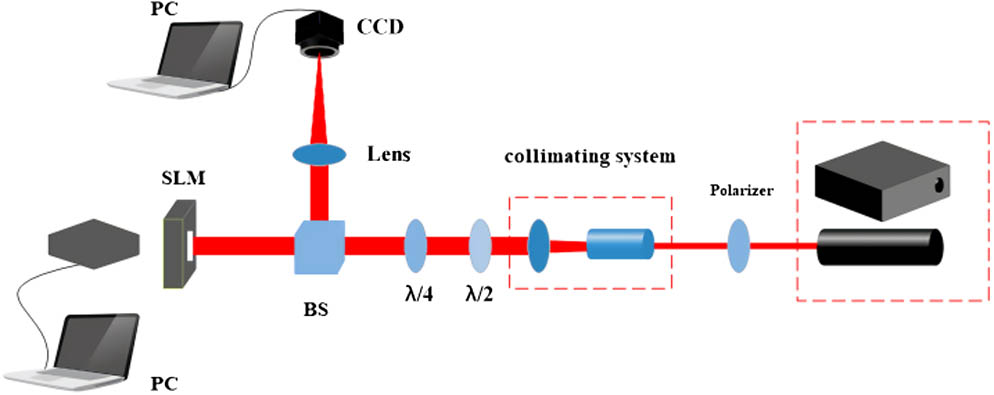
Fig. 1. Experimental device.
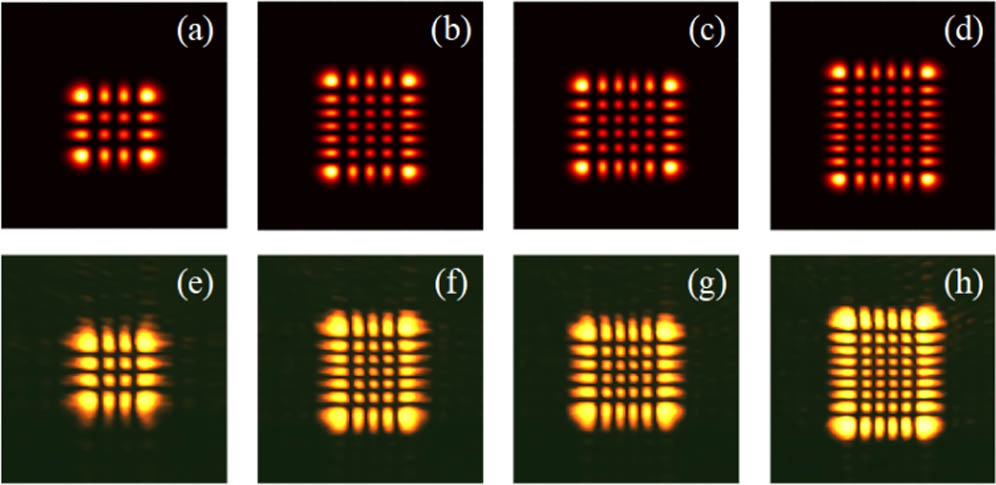
Fig. 2. Simulation and experimental comparison. (a)–(d) are simulation plots, and (e)–(h) are experimental plots. (a), (e)
Fig. 3. When the vortex parameter
Fig. 4. Diagram of HG beams with
Fig. 5. Sinusoidal vortex modulated HG beam diagram with different-order vortex parameters,
Fig. 6. Sinusoidal vortex modulated HG beam with
Fig. 7. Data analysis diagram of sinusoidal vortex modulation with parameters

Set citation alerts for the article
Please enter your email address
© Copyright 2018-2021 | Chinese Laser Press. All Rights Reserved 沪ICP备15018463号-20