
Jia Li, Boyu Tian, Jiangchuan Yu, Bin Zhang. Method for Self-Correction of Annular Off-Axis Aberrations in Two-Stage Tube Laser Amplifiers[J]. Chinese Journal of Lasers, 2021, 48(13): 1301006
- Chinese Journal of Lasers
- Vol. 48, Issue 13, 1301006 (2021)
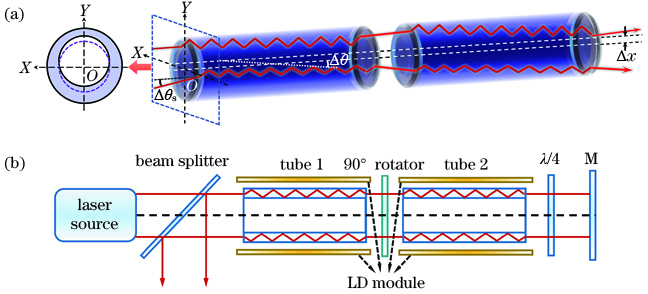
Fig. 1. Schematic diagram of two-stage tube laser amplifier. (a) Production of annular aberration;(b) schematic diagram of tube laser structure
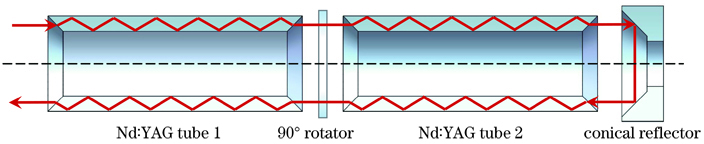
Fig. 2. Schematic diagram of configuration for correcting in two-stage tube laser amplifier with self-correction
Fig. 3. Comparison of the curves of β factor and far-field intensity distributions before and after self-correction.(a1)--(a8) Concentricity error; (b1)--(b8) parallelism error; (c1)--(c8) collimation error
Fig. 4. Intensity distribution with self-correction on the focal plane(Δθs=1 mrad)
Fig. 5. Wavefront aberration decomposition of tube laser. (a) Wavefront before correction;(b) wavefront after correction
Fig. 6. Schematic diagram of matching error of two-stage tubes
Fig. 7. Schematic diagram of right-angle conical reflector errors. (a) Translation error and rotation error; (b) taper error
Fig. 8. Curves of β factor and far-field intensity distributions after non-ideal cone lens compensation. (a) Translation errors; (b) rotation errors; (c) taper errors
Fig. 9. Wavefront aberration decomposition of tube laser. (a) Translation error is 10 μm; (b) rotation error is 10 mrad; (c) taper error is 20 μrad
| ||||||||||||||||||||||||||||||||||||||||||||||||||||||
Table 1. Comparison of self-correction effect before and after concentricity error
| ||||||||||||||||||||||||||||||||||||||||||
Table 2. Comparison of self-correction effect before and after parallelism error

Set citation alerts for the article
Please enter your email address
© Copyright 2018-2021 | Chinese Laser Press. All Rights Reserved 沪ICP备15018463号-20