
Lijuan ZHAO, Haiying ZHAO, Zhiniu XU. Design of High-sensitivity Hydrostatic Pressure Sensor Based on Brillouin Dynamic Grating[J]. Acta Photonica Sinica, 2021, 50(2): 21
- Acta Photonica Sinica
- Vol. 50, Issue 2, 21 (2021)
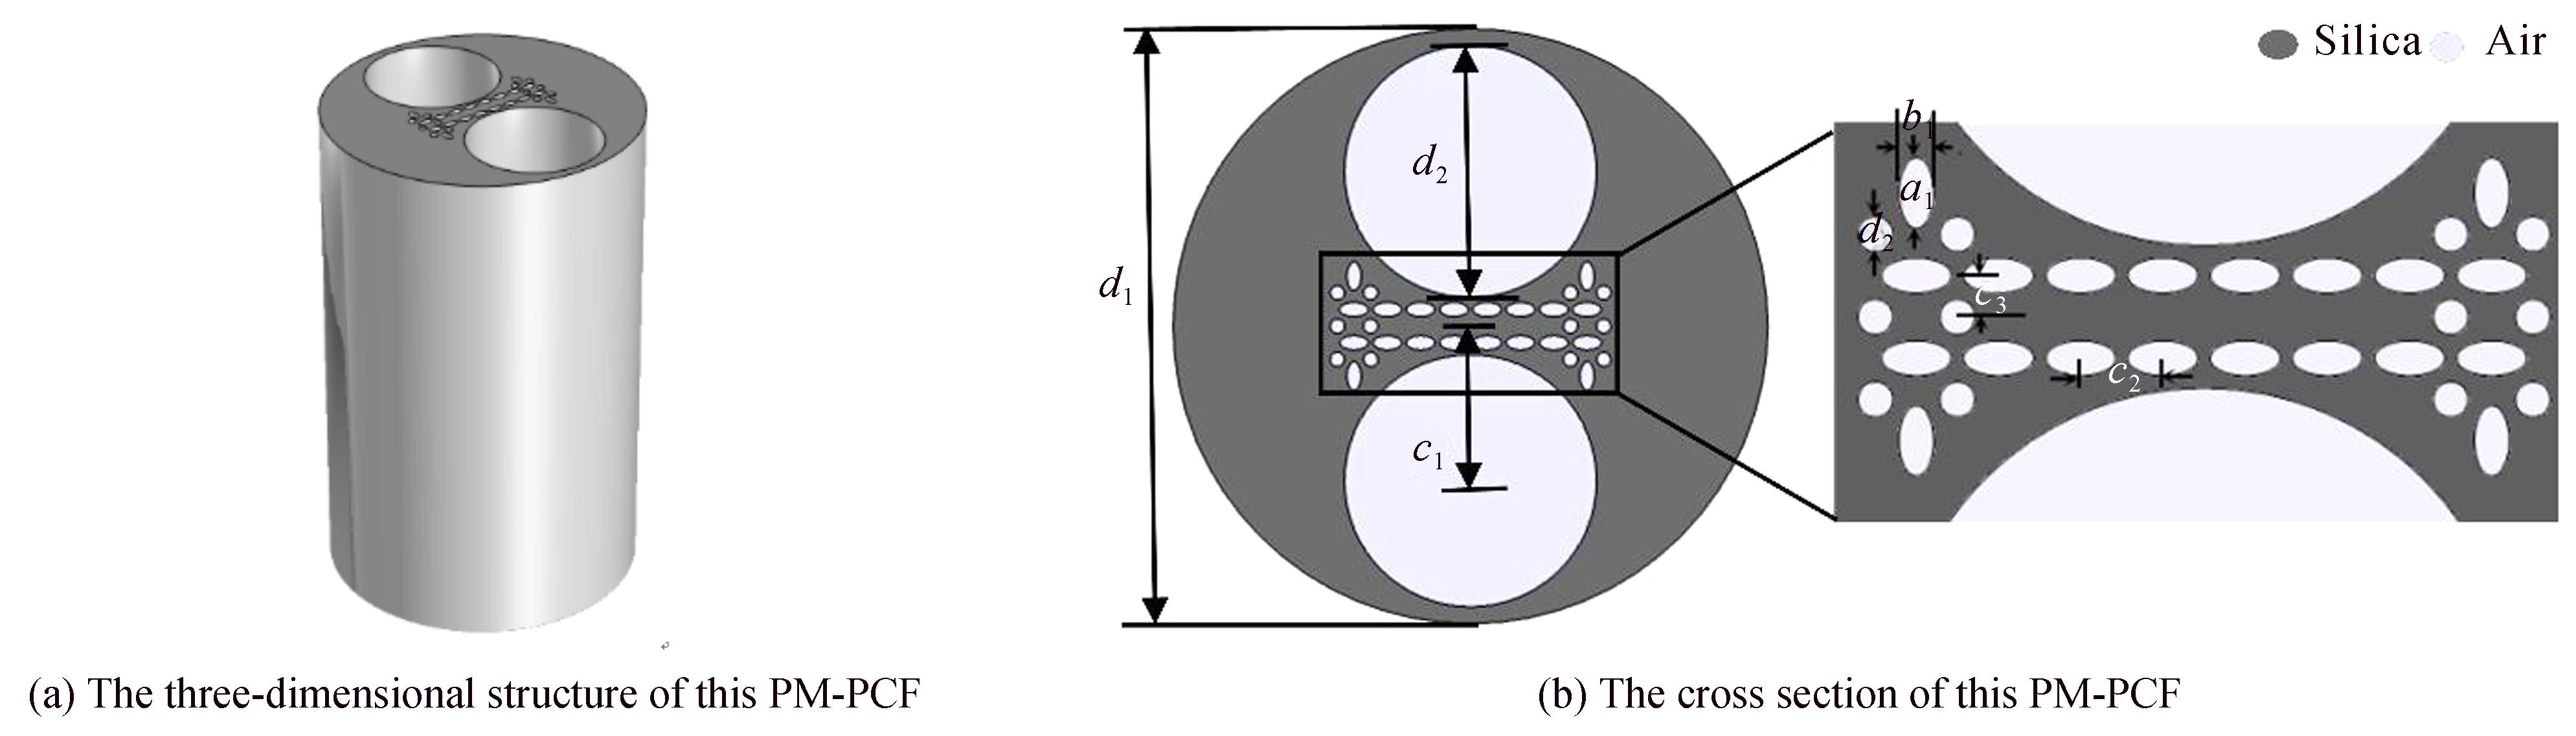
Fig. 1. The structure of designed PM-PCF structure
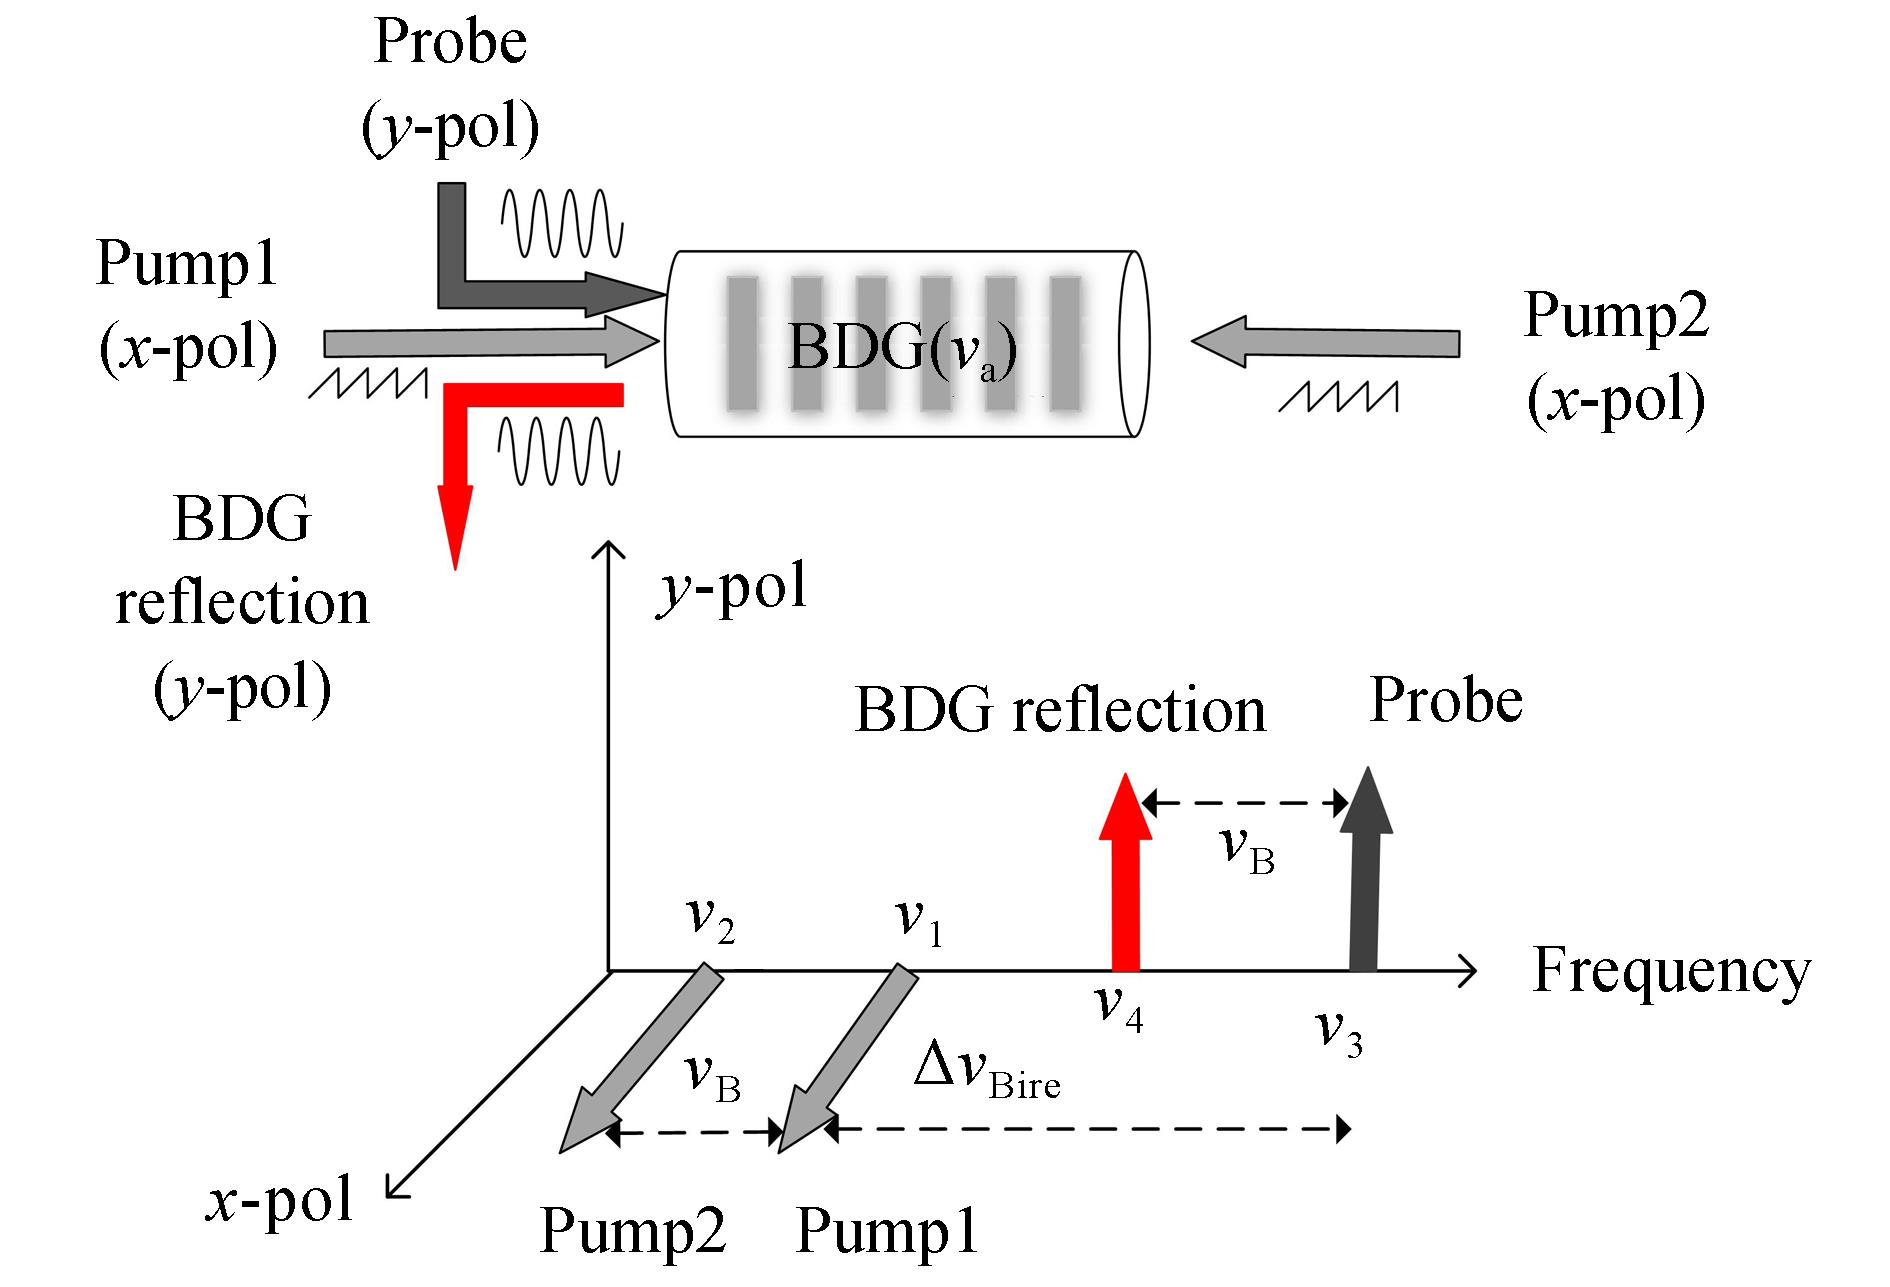
Fig. 2. The excitation and detection of Brillouin dynamic grating and operation scheme
Fig. 3. Schematic diagram of hydrostatic pressure on PM-PCF
Fig. 4. The research method of this paper
Fig. 5. Distribution of stress and refractive index when P 0=0 MPa, T 0=20℃
Fig. 6. Electric field distribution of the fundamental mode
Fig. 7. The normalized BDG spectra when P 0=0 MPa, T 0=20℃
Fig. 8. Distribution of stress and refractive index when P =1 MPa, T =20℃
Fig. 9. The refraction index as a function of hydrostatic pressure at different temperatures
Fig. 10. The normalized BDG spectra at different hydrostatic pressures
Fig. 11. The ΔυBire as a function of hydrostatic pressure at different temperatures
Fig. 12. The normalized BDG spectra at different hydrostatic pressures when T =20℃
Fig. 13. Distribution of stress and refractive index when P =0 MPa, T =0℃
Fig. 14. Refractive index distribution of the PM-PCF when P =0 MPa, T =0℃
Fig. 15. The refraction index as a function of temperature at different hydrostatic pressures
Fig. 16. The normalized BDG spectra at different temperatures
Fig. 17. The Δυ Bire as a function of temperature at different hydrostatic pressures
Fig. 18. The normalized BDG spectra at different temperatures when P =0 MPa
Fig. 19. The change of V eff with temperature or hydrostatic pressure
Fig. 20. The change of confinement loss with temperature or hydrostatic pressure
Fig. 21. The change of effective mode area with temperature or hydrostatic pressure
| ||||||||||||||||||||||||||||||||||||||||||||||||
Table 1. Specification and characteristics of Δ v ![]()
![]()

Set citation alerts for the article
Please enter your email address
© Copyright 2018-2021 | Chinese Laser Press. All Rights Reserved 沪ICP备15018463号-20