
Jiaxiao Ma, Yonghong Wang, Mingyi Zhang, Xiaoyu Bai, Xueying Liu. Penetration Characteristics of Jacked Piles with Different Pile Diameters Based on Fiber Bragg Grating Sensing Technology[J]. Chinese Journal of Lasers, 2020, 47(5): 0504003
- Chinese Journal of Lasers
- Vol. 47, Issue 5, 0504003 (2020)
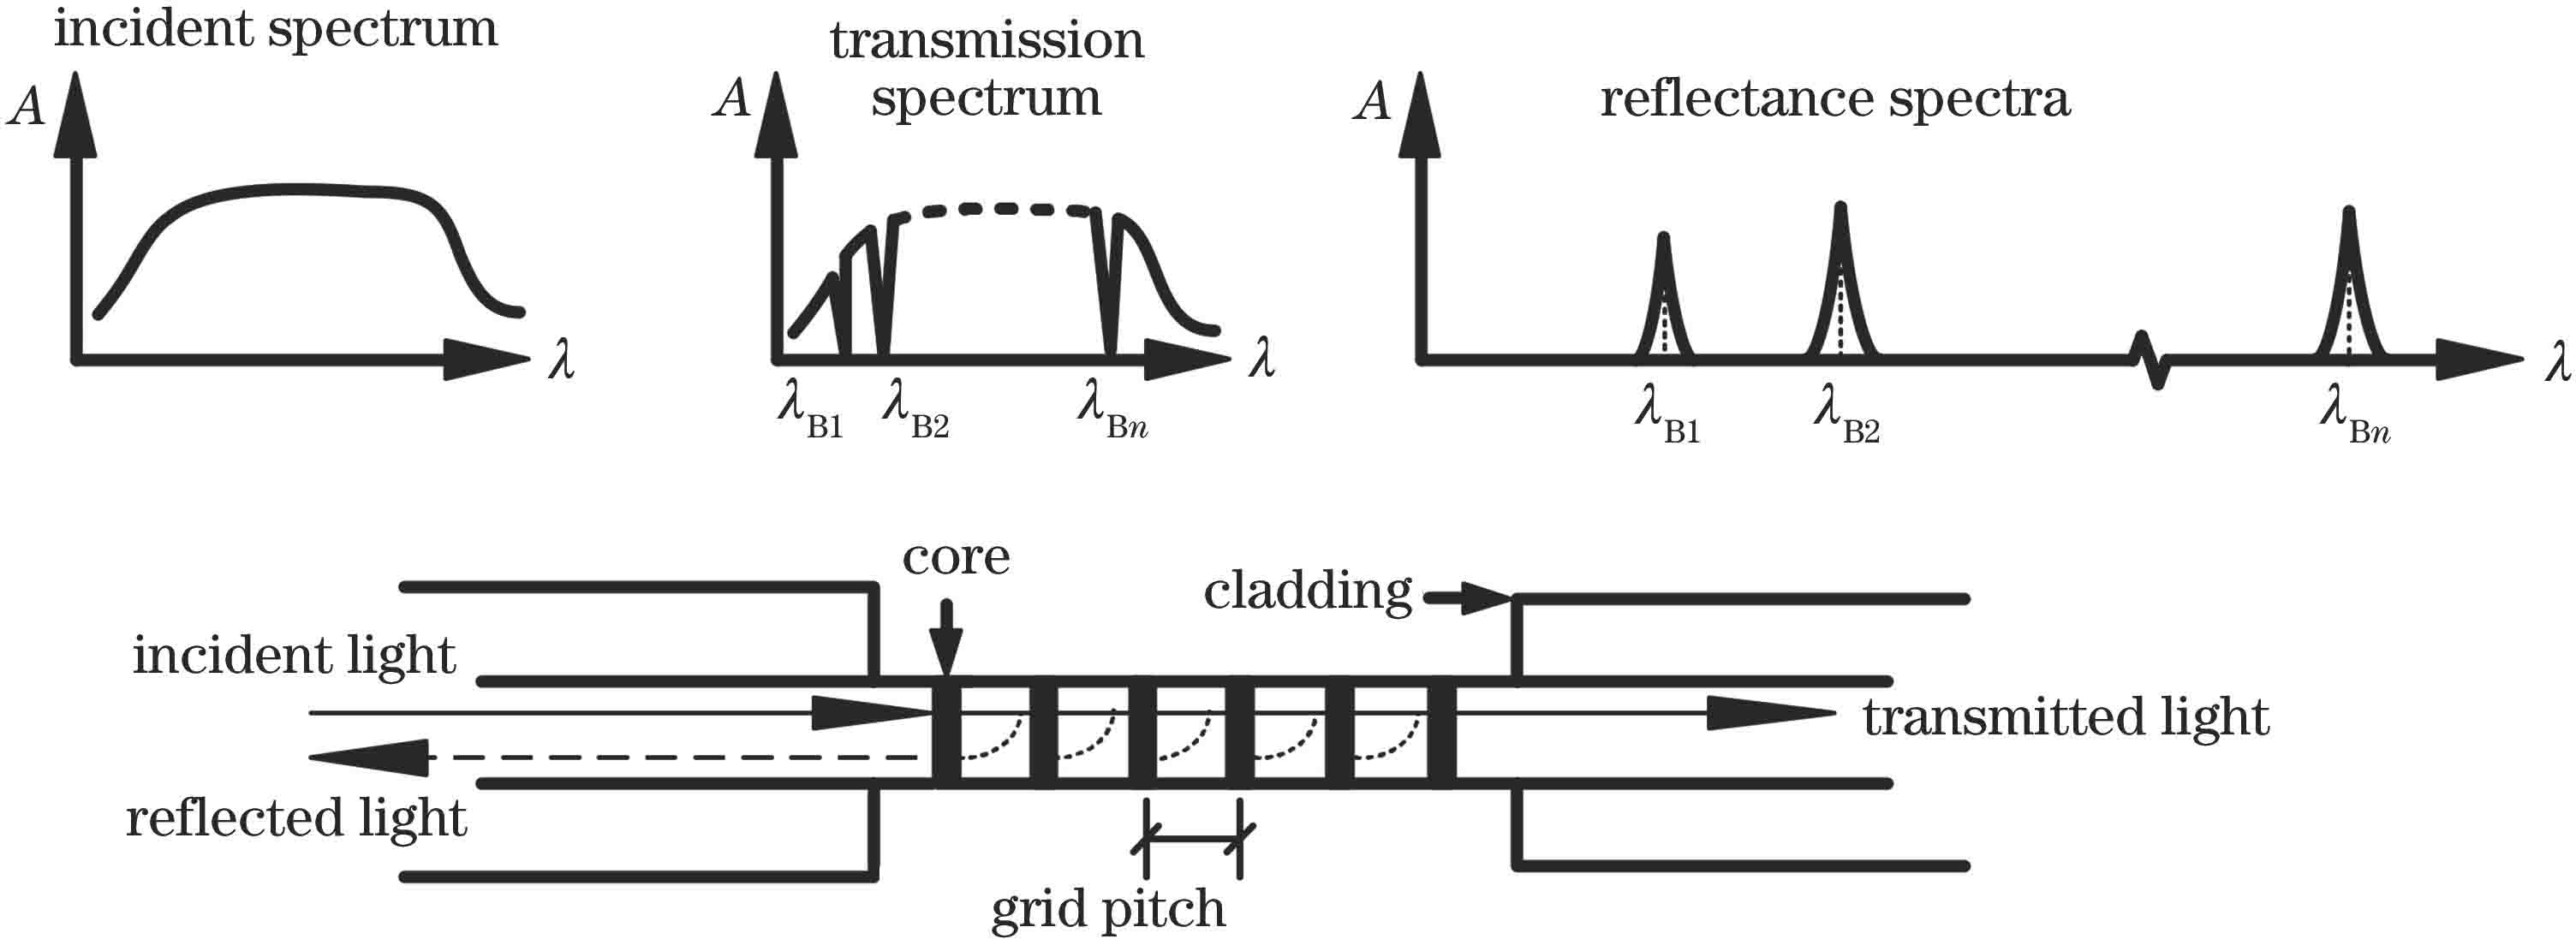
Fig. 1. Working schematic of FBG
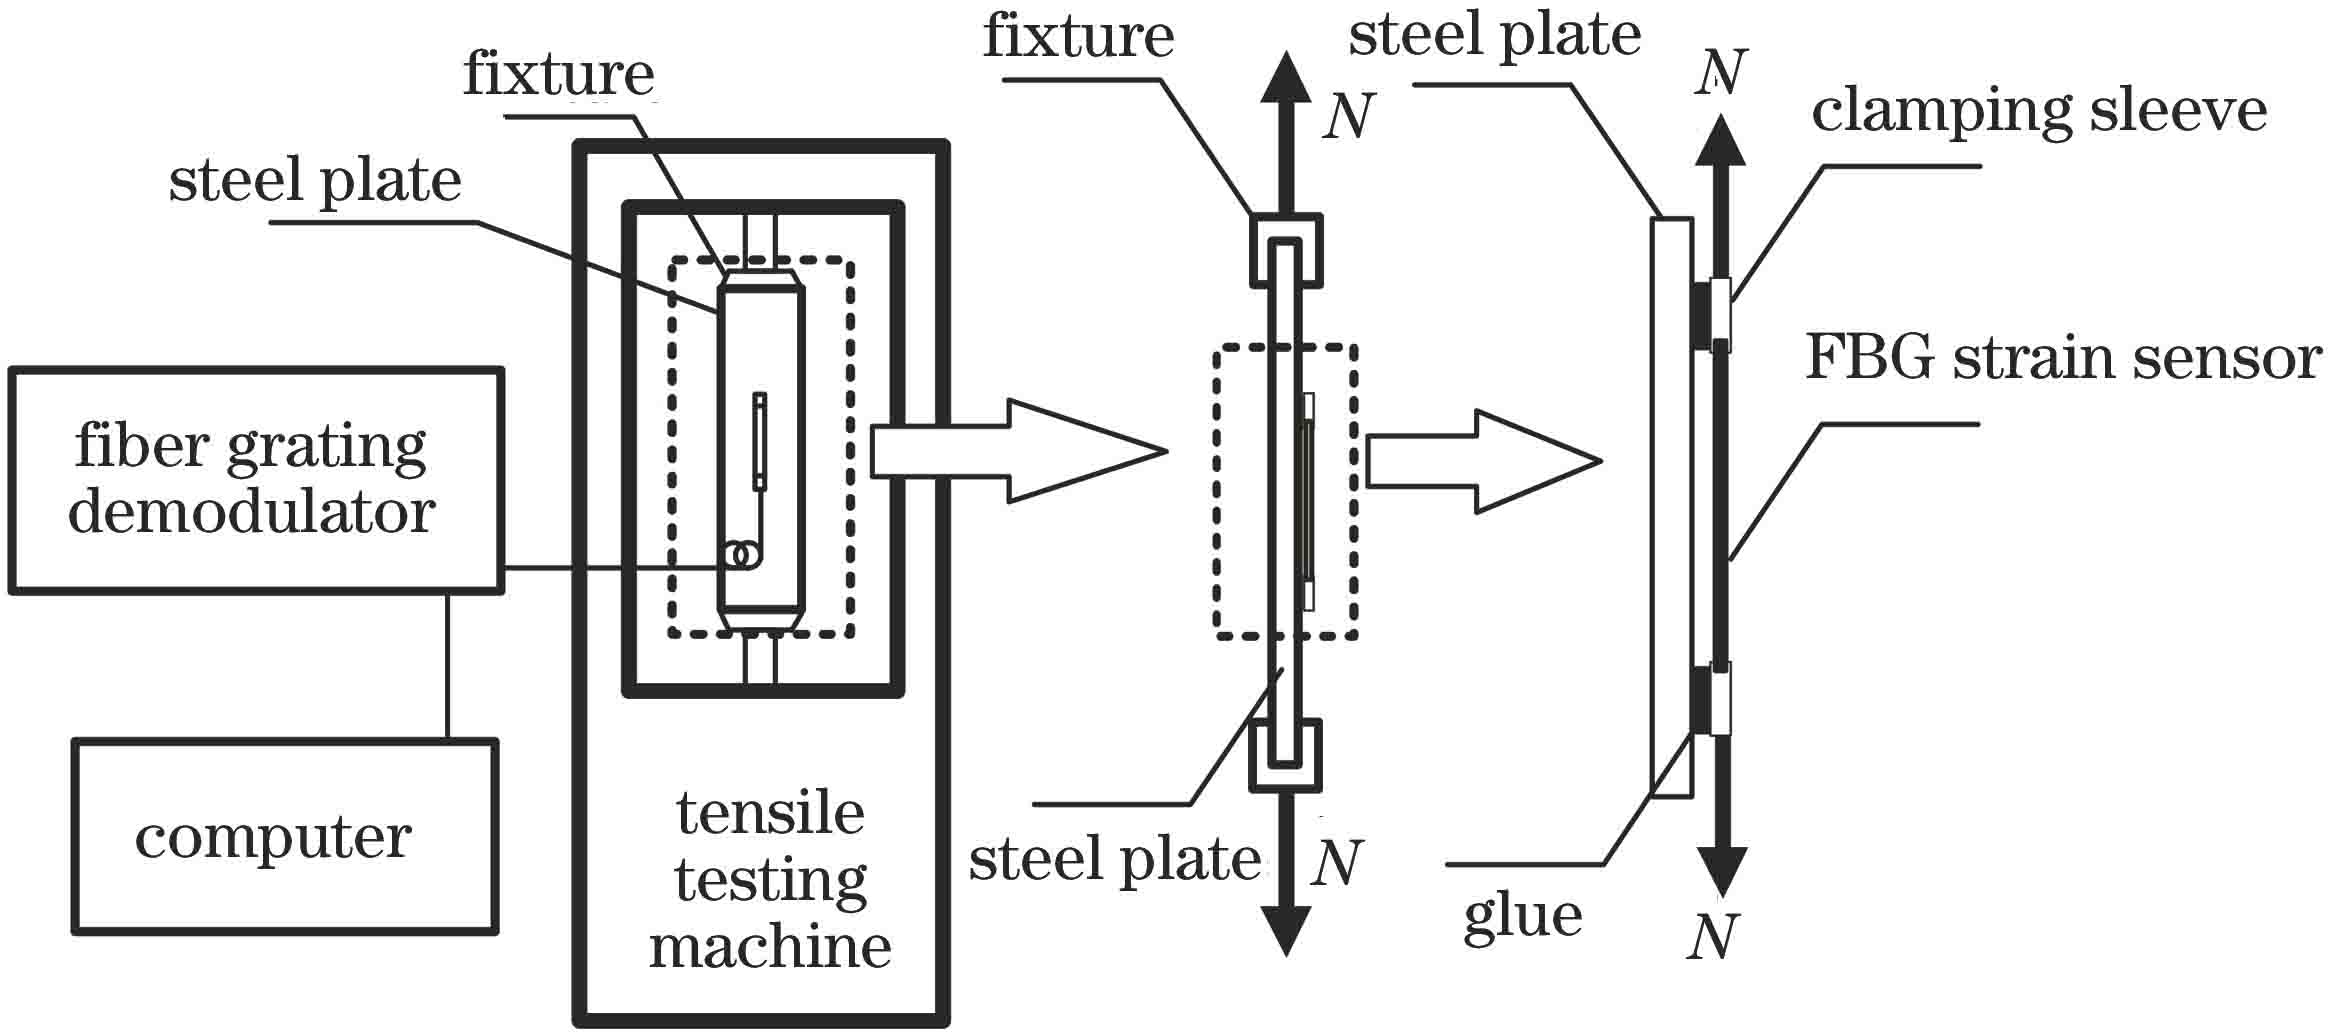
Fig. 2. Calibration schematic of FBG strain sensor
Fig. 3. Calibration curve of FBG strain sensor
Fig. 4. Schematic of FBG pressure sensor
Fig. 5. Calibration device of FBG pressure sensor
Fig. 6. Calibration curve of FBG pressure sensor
Fig. 7. Schematic of model pile structure and installation of sensors. (a) Schematic; (b) physical drawing
Fig. 8. Test system of sensor experiment
Fig. 9. Variation curves of pile driving force and pile end resistance
Fig. 10. Driving pressure and end resistance of model pile TP1
Fig. 11. Driving pressure and end resistance of model pile TP2
Fig. 12. Relationship among pile end resistance, end resistance ratio, and penetration depth of pile body
Fig. 13. Relationship among side friction, side friction ratio, and penetration depth of pile body
Fig. 14. Axial force of model pile TP1
Fig. 15. Axial force of model pile TP2
Fig. 16. Unit skin friction of model pile TP1
Fig. 17. Unit skin friction of model pile TP2
|
Table 1. Model pile parameters
|
Table 2. Parameters of FBG demodulator

Set citation alerts for the article
Please enter your email address
© Copyright 2018-2021 | Chinese Laser Press. All Rights Reserved 沪ICP备15018463号-20