• Photonics Research
  • Vol. 10, Issue 12, 2760 (2022)
He Zhang1、2, Santosh Kumar1、2, Yong Meng Sua1、2, Shenyu Zhu1、2, and Yu-Ping Huang1、2、*
Author Affiliations
  • 1Department of Physics, Stevens Institute of Technology, Hoboken, New Jersey 07030, USA
  • 2Center for Quantum Science and Engineering, Stevens Institute of Technology, Hoboken, New Jersey 07030, USA
  • show less
    DOI: 10.1364/PRJ.458813 Cite this Article Set citation alerts
    He Zhang, Santosh Kumar, Yong Meng Sua, Shenyu Zhu, Yu-Ping Huang. Near-infrared 3D imaging with upconversion detection[J]. Photonics Research, 2022, 10(12): 2760 Copy Citation Text show less
    (a) Experiment setup. Mode-locked laser pulses are separated into two arms by using WDM filters, with signal and pump wavelengths at 1545 and 1558 nm, respectively. The signal beam is incident on an obscured object. The backscattered signal photons are combined with the pump and are then upconverted in a nonlinear crystal to generate SF output centered at wavelength 775.5 nm. The time-resolved measurements can faithfully reconstruct the 3D object image captured by the EMCCD camera. (b) Picture of the object (a washer) attached on an aluminum block. (c) Picture of the obscured object, i.e., the washer obscured by the scattering media (SM). WDM, wavelength division multiplexer; EDFA, erbium-doped fiber amplifier; QWP, quarter-wave plate; HWP, half-wave plate; BS, beam splitter; FL, Fourier lens; PPLN crystal, magnesium-doped periodically poled lithium niobate crystal; EMCCD, electron multiplying silicon charge coupled device; ASE, amplified spontaneous emission.
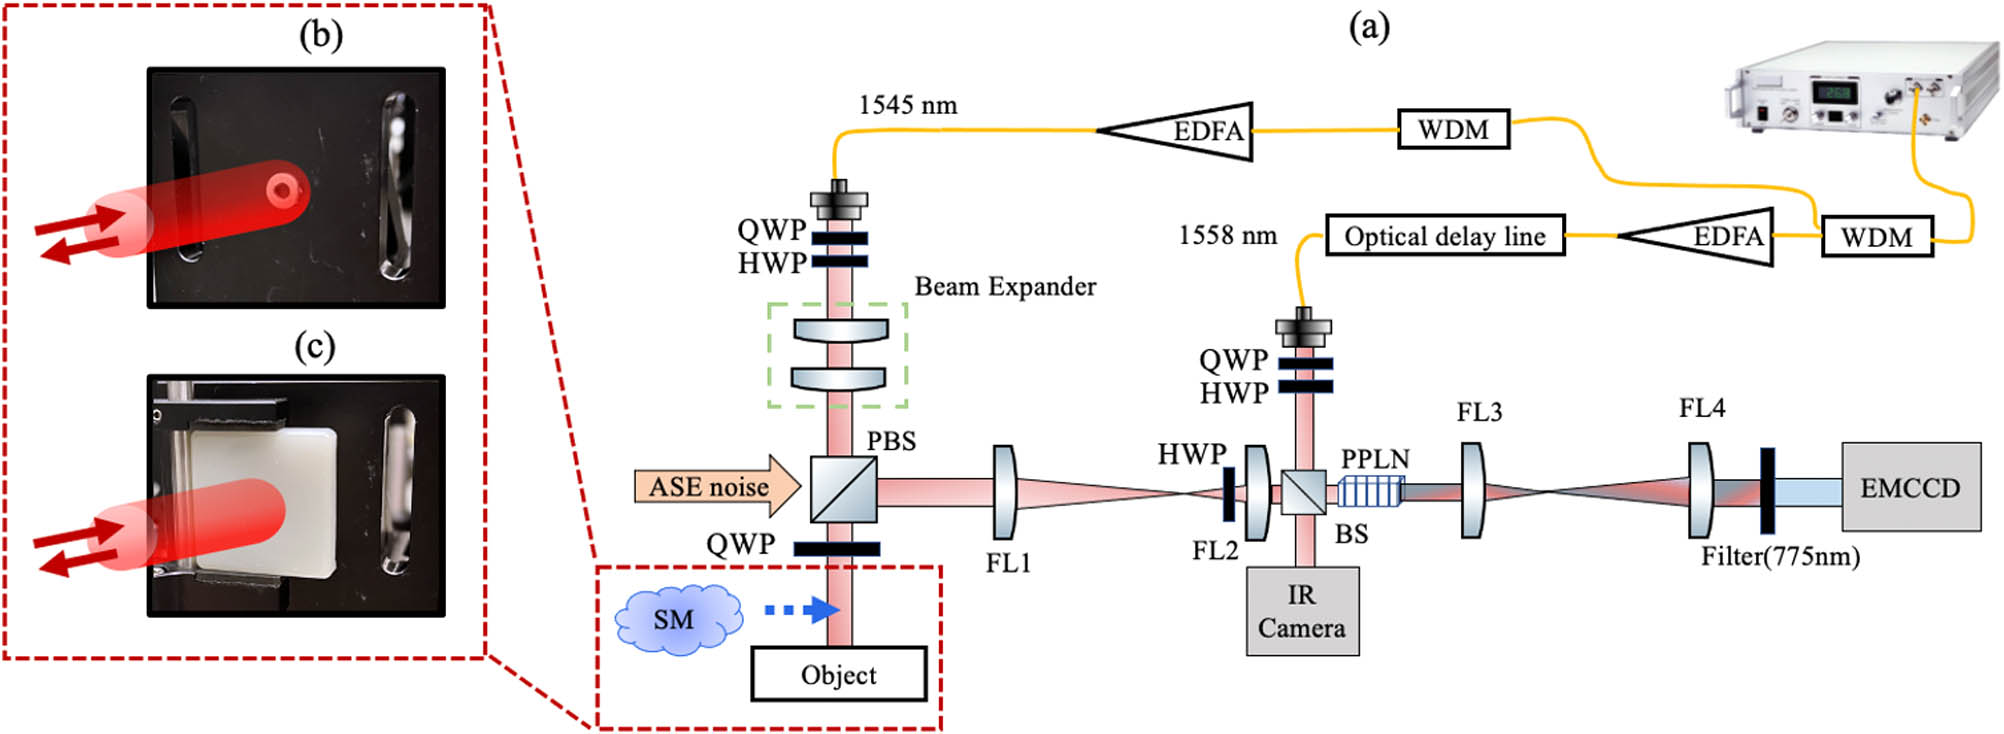
    Fig. 1. (a) Experiment setup. Mode-locked laser pulses are separated into two arms by using WDM filters, with signal and pump wavelengths at 1545 and 1558 nm, respectively. The signal beam is incident on an obscured object. The backscattered signal photons are combined with the pump and are then upconverted in a nonlinear crystal to generate SF output centered at wavelength 775.5 nm. The time-resolved measurements can faithfully reconstruct the 3D object image captured by the EMCCD camera. (b) Picture of the object (a washer) attached on an aluminum block. (c) Picture of the obscured object, i.e., the washer obscured by the scattering media (SM). WDM, wavelength division multiplexer; EDFA, erbium-doped fiber amplifier; QWP, quarter-wave plate; HWP, half-wave plate; BS, beam splitter; FL, Fourier lens; PPLN crystal, magnesium-doped periodically poled lithium niobate crystal; EMCCD, electron multiplying silicon charge coupled device; ASE, amplified spontaneous emission.
    Field of view and spatial resolution of upconverted images using two different experimental situations. (a) Upconversion image of group 1 in USAF resolution test chart from the experiment setup depicted in Fig. 1(a). (b) Intensity profile along the blue dashed line in (a). (c) Upconversion image of group 3 in USAF resolution test chart with another experimental setting. In this case, the signal beam size is reduced to 3.6 mm FWHM and the first Fourier lens (FL) of the object 4f imaging system is changed to focal length of 100 mm. (d) Intensity profile along the red dashed line in (c).
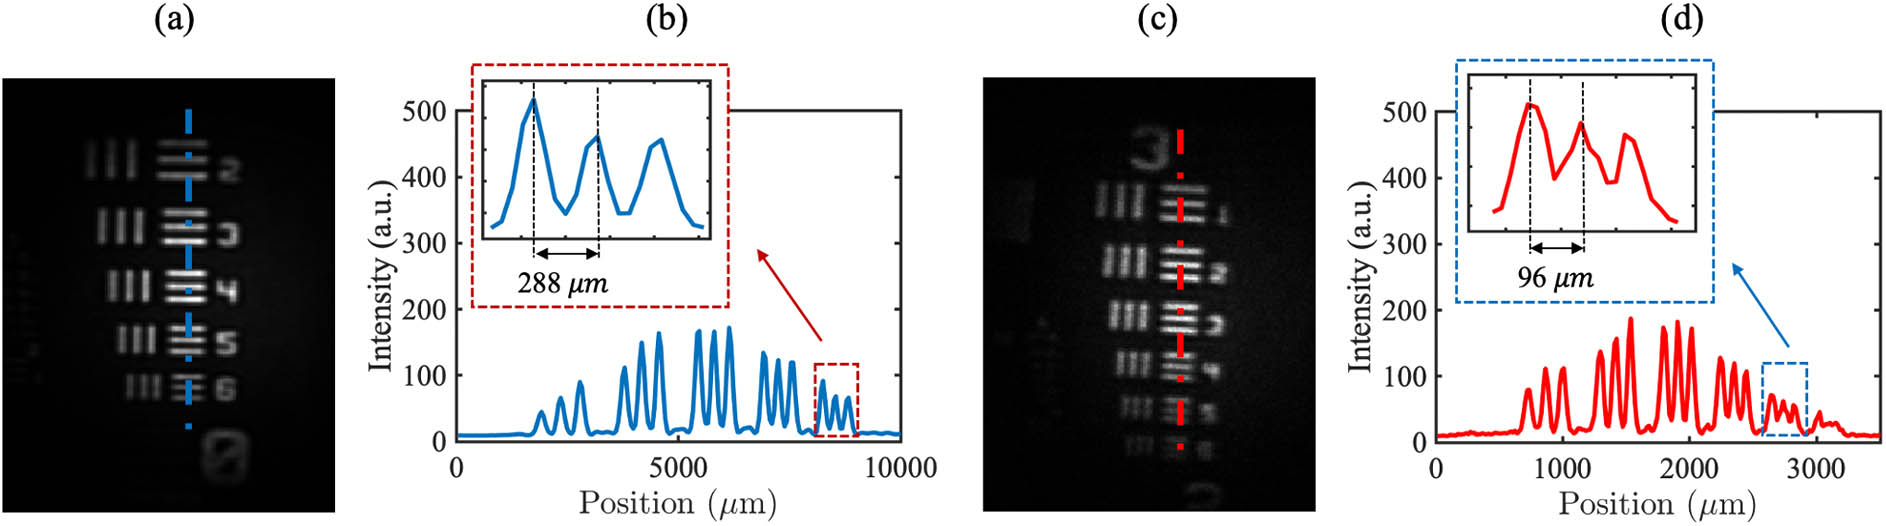
    Fig. 2. Field of view and spatial resolution of upconverted images using two different experimental situations. (a) Upconversion image of group 1 in USAF resolution test chart from the experiment setup depicted in Fig. 1(a). (b) Intensity profile along the blue dashed line in (a). (c) Upconversion image of group 3 in USAF resolution test chart with another experimental setting. In this case, the signal beam size is reduced to 3.6 mm FWHM and the first Fourier lens (FL) of the object 4f imaging system is changed to focal length of 100 mm. (d) Intensity profile along the red dashed line in (c).
    (a1)–(a7) illustrate the present 3D imaging method. (a1) presents the intensity measurement for the input signal and pump at different arrival times, with the corresponding SF intensity shown in (a2). (a3)–(a5) show the spatial information at different arrival time I, II, and III, respectively. (a6) shows the reconstruction procedure of the 3D data set collection. At each pump delay, 2D image data are acquired by the camera in each frame, and the z dimension represents the photon’s flight distance. (a7) shows post-processing data of (a6), in which the z axis gives the depth information of the target object. The object photos with profile data for the washer and bolt are shown in (b1) and (c1), respectively. After performing 3D imaging measurement, the results for washer and bolt are shown in (b2) and (c2), respectively.
    Fig. 3. (a1)–(a7) illustrate the present 3D imaging method. (a1) presents the intensity measurement for the input signal and pump at different arrival times, with the corresponding SF intensity shown in (a2). (a3)–(a5) show the spatial information at different arrival time I, II, and III, respectively. (a6) shows the reconstruction procedure of the 3D data set collection. At each pump delay, 2D image data are acquired by the camera in each frame, and the z dimension represents the photon’s flight distance. (a7) shows post-processing data of (a6), in which the z axis gives the depth information of the target object. The object photos with profile data for the washer and bolt are shown in (b1) and (c1), respectively. After performing 3D imaging measurement, the results for washer and bolt are shown in (b2) and (c2), respectively.
    3D reconstructed image through scattering media. Two SM samples are used (Table 1); the results of SM1 with optical depth 14.58ls for double passes are shown in the second row, and the results of SM2 with optical depth 8.08ls are shown in the third row. The time window can partially discard the redundant noise in the temporal scans and improve the reconstructed image contrast.
    Fig. 4. 3D reconstructed image through scattering media. Two SM samples are used (Table 1); the results of SM1 with optical depth 14.58ls for double passes are shown in the second row, and the results of SM2 with optical depth 8.08ls are shown in the third row. The time window can partially discard the redundant noise in the temporal scans and improve the reconstructed image contrast.
    3D image reconstruction through addition noises in the time-frequency and spatial domain. (a) Signal image before upconversion captured using the IR camera, which is reflected from the target object and mixed with time-frequency and spatial noises. (b) Upconverted SF image at a certain arrival time, which can be captured using the EMCCD. (c) Reconstructed 3D image.
    Fig. 5. 3D image reconstruction through addition noises in the time-frequency and spatial domain. (a) Signal image before upconversion captured using the IR camera, which is reflected from the target object and mixed with time-frequency and spatial noises. (b) Upconverted SF image at a certain arrival time, which can be captured using the EMCCD. (c) Reconstructed 3D image.
    Reconstructed 3D image of washer for a series of exposure times: (a) 0.1 s, (b) 1 s, and (c) 2 s.
    Fig. 6. Reconstructed 3D image of washer for a series of exposure times: (a) 0.1 s, (b) 1 s, and (c) 2 s.
    3D imaging measurement for the target object with diffusive surface. (a) Photo for target object. (b) Reconstructed image without scattering media. (c) Reconstructed image of the object with scattering media placed in front of it. (d) Post-processing image of (c).
    Fig. 7. 3D imaging measurement for the target object with diffusive surface. (a) Photo for target object. (b) Reconstructed image without scattering media. (c) Reconstructed image of the object with scattering media placed in front of it. (d) Post-processing image of (c).
     SampleMean Free Path (ls)Optical Depth (Round Trip)
    SM14.3 mm0.58 mm14.58ls
    SM23.2 mm0.66 mm8.08ls
    Table 1. Parameters of Scattering Media
    He Zhang, Santosh Kumar, Yong Meng Sua, Shenyu Zhu, Yu-Ping Huang. Near-infrared 3D imaging with upconversion detection[J]. Photonics Research, 2022, 10(12): 2760
    Download Citation