
Yang Lai, Jindong Wang, Haoran Guo, Xu Wang, Mengxin Fu, Weiwei Liu. Online Detection Method for Metro Pantograph Wear Based on Line‑Laser Measurement[J]. Chinese Journal of Lasers, 2023, 50(23): 2304001
- Chinese Journal of Lasers
- Vol. 50, Issue 23, 2304001 (2023)
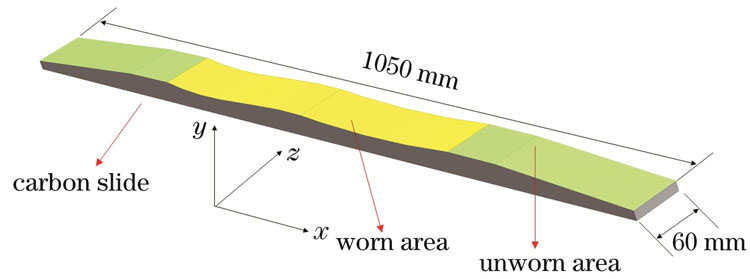
Fig. 1. Schematic diagram of carbon slide wear
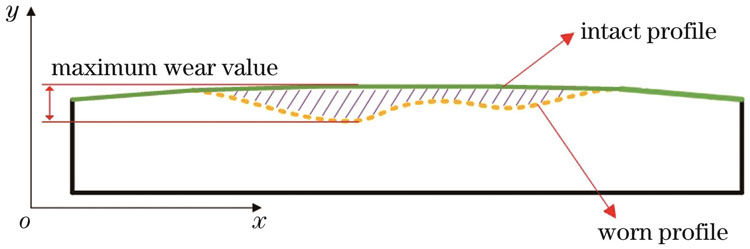
Fig. 2. Wear calculation of carbon slide
Fig. 3. Schematic diagram of online detection system for pantograph wear
Fig. 4. Raw profile of pantograph. (a) Valid profile; (b) invalid profile
Fig. 5. Pantograph feature region
Fig. 6. Schematic diagram of point cloud window
Fig. 7. Variance value of window traversal
Fig. 8. Point-line distance
Fig. 9. Four verified results of feature point search
Fig. 10. Filtering of profile data
Fig. 11. Rough registration of profile data. (a) Before registration; (b) after registration
Fig. 12. Interval partitioning of profile data. (a) Standard profile; (b) source profile
Fig. 13. Registered result of profile data
Fig. 14. Testing experiment of pantograph wear detection
| |||||||||||||||||||||||
Table 1. Accuracy verification of feature point search
| |||||||||||||||||||||||||||||||||||||||||||||||||||||||||||
Table 2. Testing results of pantograph wear

Set citation alerts for the article
Please enter your email address
© Copyright 2018-2021 | Chinese Laser Press. All Rights Reserved 沪ICP备15018463号-20