
Hongqiang Zhou, Xin Li, Zhentao Xu, Xiaowei Li, Guangzhou Geng, Junjie Li, Yongtian Wang, Lingling Huang, "Correlated triple hybrid amplitude and phase holographic encryption based on a metasurface," Photonics Res. 10, 678 (2022)
- Photonics Research
- Vol. 10, Issue 3, 678 (2022)
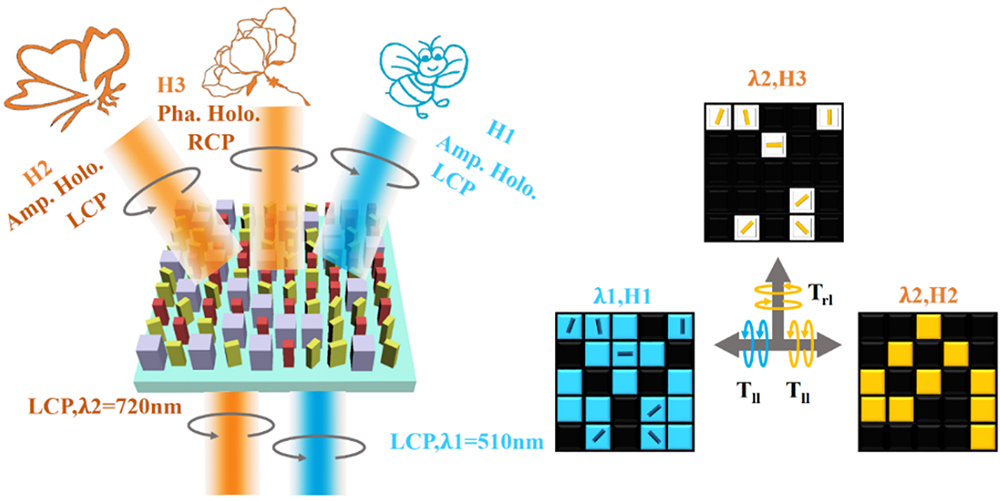
Fig. 1. Scheme of correlated triple amplitude and phase holography. The two amplitude holograms (H1 and H2) and the phase hologram (H3) are shown in the right panel. The cyan blocks represent transmission at λ 1 = 510 nm λ 2 = 720 nm H 1 = H 2 ∪ H 3
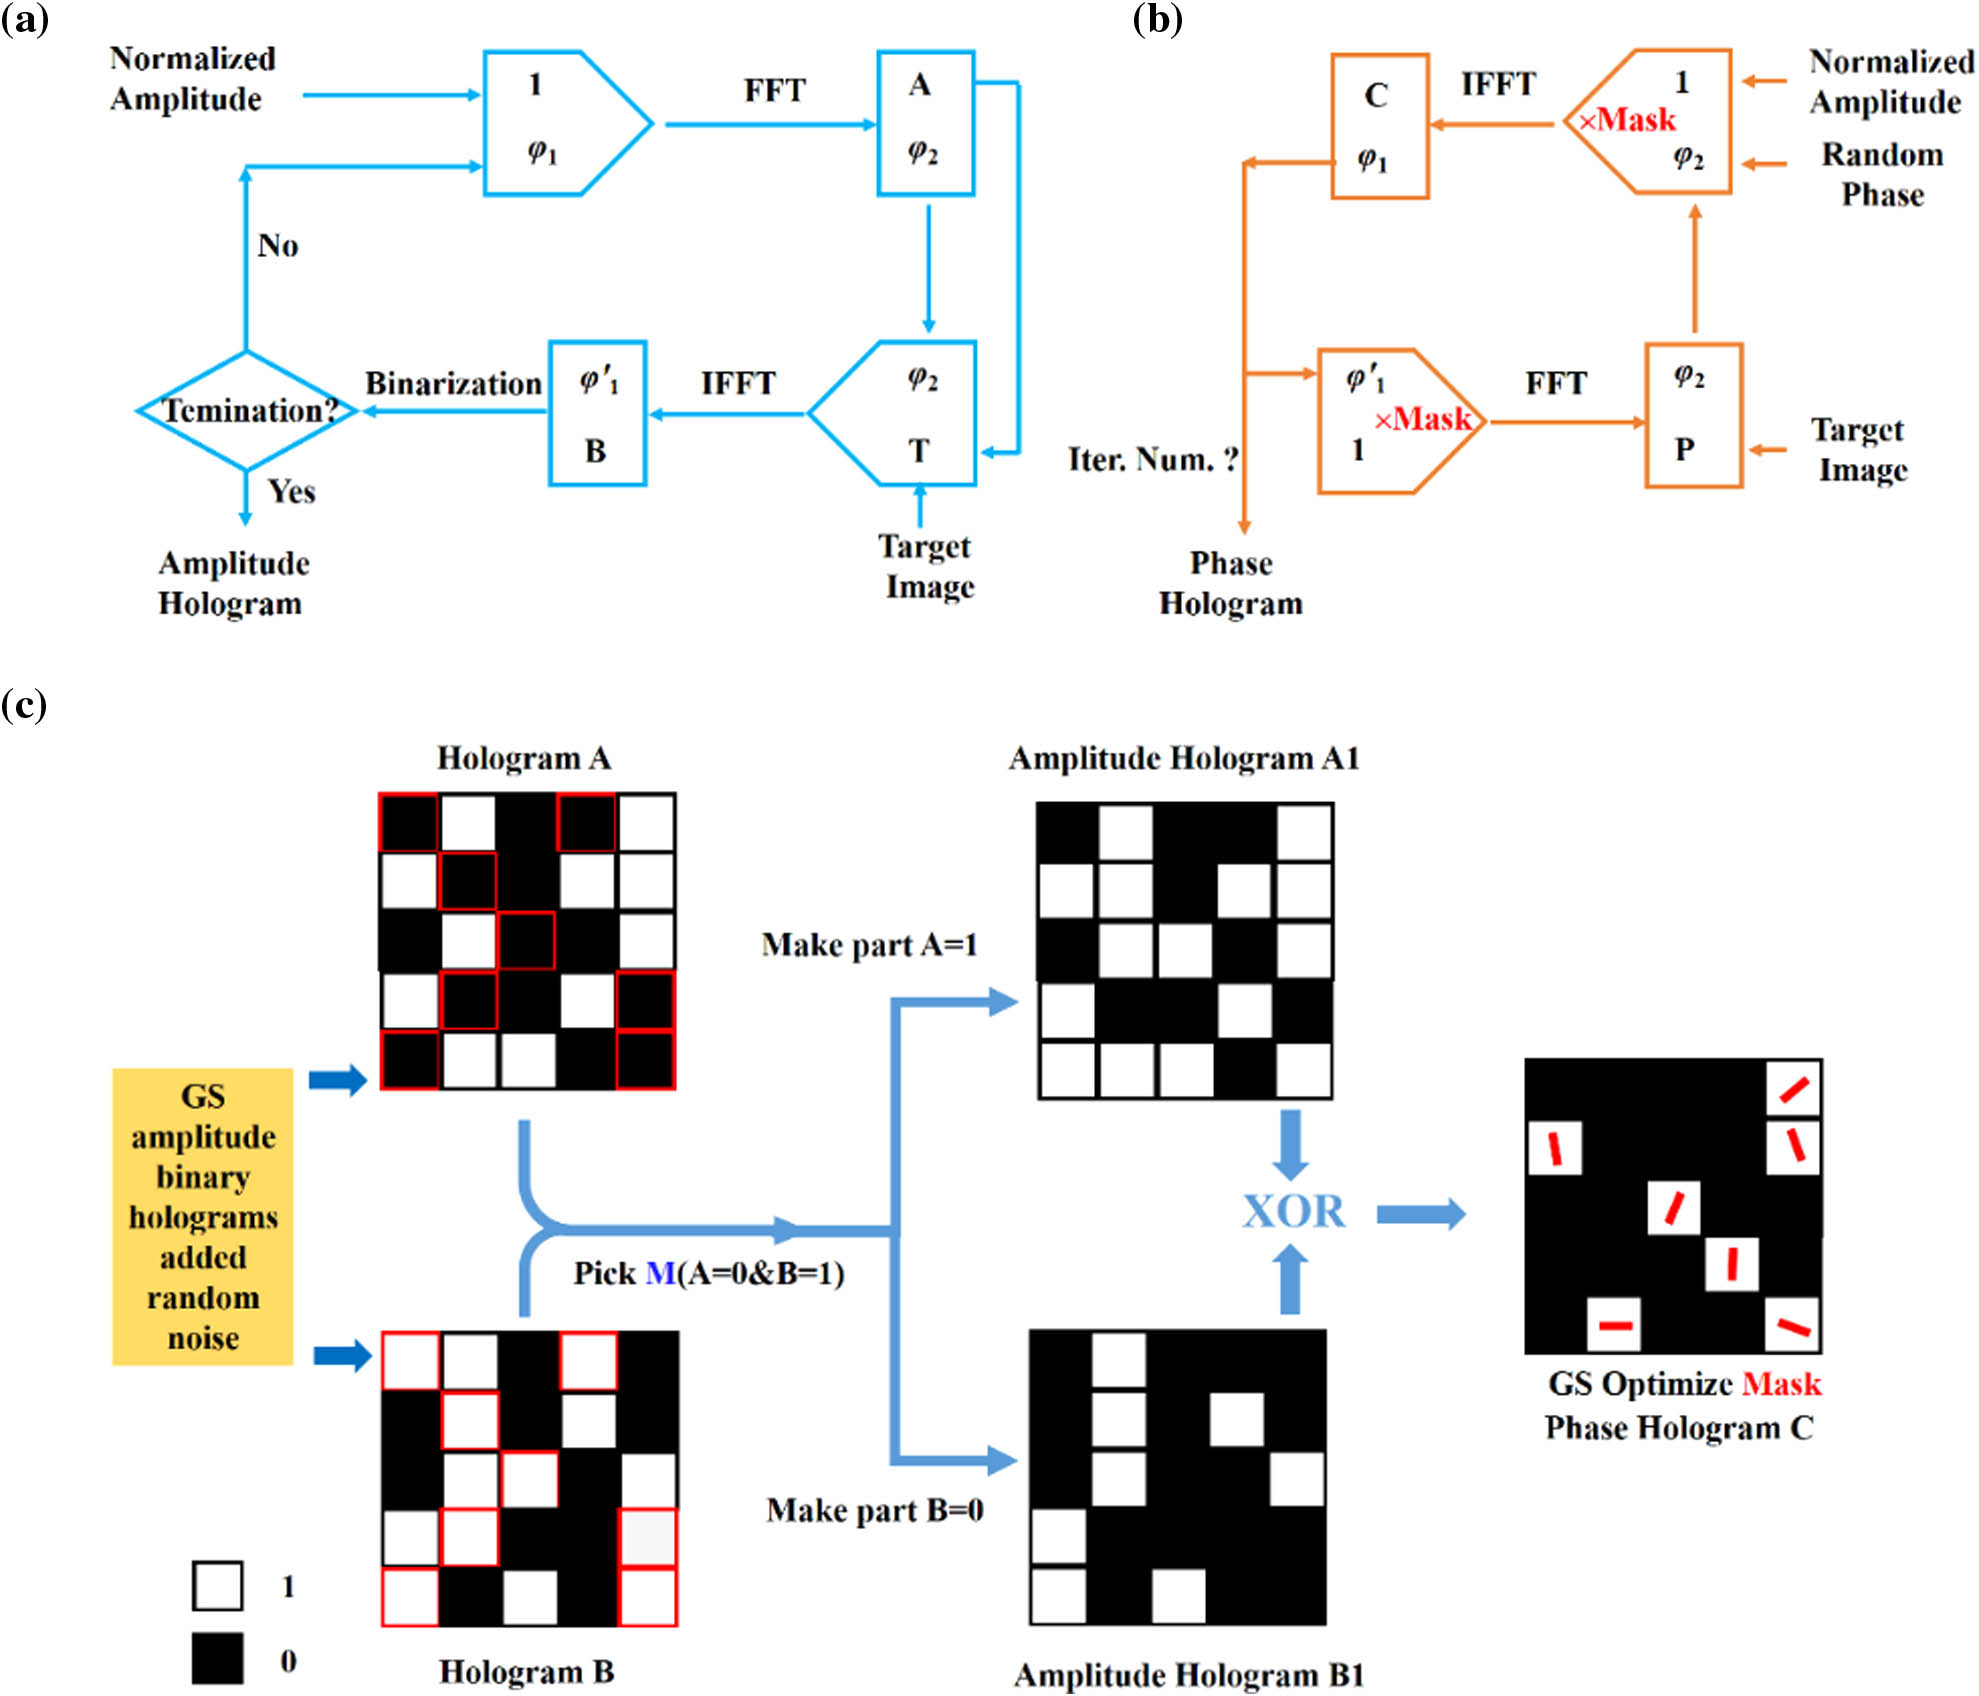
Fig. 2. Flowchart of correlated Gerchberg–Saxton (CGS) holographic algorithm. (a) Binary amplitude holographic CBGS algorithm. (b) Traditional phase hologram generation by GS algorithm. (c) Flowchart of correlated triple hologram algorithm with rigorous mathematical relations.
Fig. 3. Three kinds of selected nanofins. (a) Three optimized nanofins, with one anisotropic cross-section and two isotropic cross-sections. (b) Intensity map of swept square length. (c)–(e) Co- and cross-polarization transmission (T ll T rl
Fig. 4. Metasurface samples and experimental optical setup. (a) and (b) Scanning electron microscope (SEM) images with top view and 45° tilt view, scale bar: 4 μm. (c) Experimental optical setup: LP1, LP2, linear polarizer; QWP1, QWP2, quarter-wave plate; CMOS, complementary metal-oxide-semiconductor. (d) Co-polarization and cross-polarization transmission efficiency of metasurface sample.
Fig. 5. Simulations and experimental results of triple amplitude phase holography using different wavelength and polarization combinations. (a) Simulation in co-polarization T ll λ 1 = 510 nm T ll λ 2 = 720 nm T rl λ 2 = 720 nm T ll λ 1 = 510 nm T ll λ 2 = 720 nm T rl λ 2 = 720 nm
Fig. 6. Simulations and experimental results of triple amplitude phase holography of the new sample using different wavelength and polarization combinations. (a) Simulation in co-polarization T ll λ 1 = 510 nm T ll λ 2 = 720 nm T rl λ 2 = 720 nm T ll λ 1 = 510 nm T ll λ 2 = 720 nm T rl λ 2 = 720 nm
Fig. 7. Experimental results of broadband holographic reconstruction of Sample 1 in far-field co-polarization (T ll
Fig. 8. Experimental results of broadband holographic reconstruction of Sample 2 in far-field co-polarization (T ll
Fig. 9. Experimental results of broadband holographic reconstruction of Sample 1 in far-field cross-polarization (T rl
Fig. 10. Experimental results of broadband holographic reconstruction of Sample 2 in far-field cross-polarization (T rl


Set citation alerts for the article
Please enter your email address

© Copyright 2018-2021 | Chinese Laser Press. All Rights Reserved 沪ICP备15018463号-20