
Cencen Zhu, Jia Li, Qiuping Lan, Xu Wang, Yanming Chen. Riparian Line Extraction in Complex Environment Based on Line Scanning Data[J]. Chinese Journal of Lasers, 2023, 50(23): 2309001
- Chinese Journal of Lasers
- Vol. 50, Issue 23, 2309001 (2023)
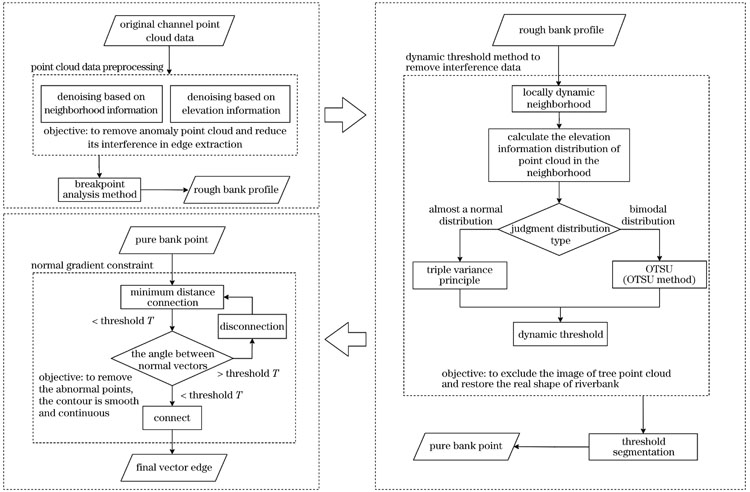
Fig. 1. Flow chart for riparian line extraction
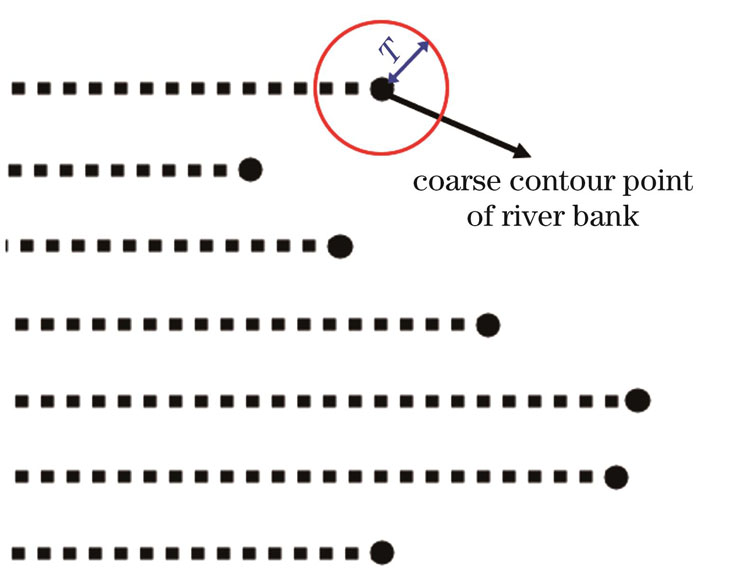
Fig. 2. Diagram of rough river shoreline extraction
Fig. 3. Dynamic threshold removes the high point
Fig. 4. Shoreline “burr” points
Fig. 5. Normal angle diagram
Fig. 6. Normal gradient constraint joins adjacent points
Fig. 7. Remove tidal points
Fig. 8. Remove high noise points
Fig. 9. Riverbank rough contour
Fig. 10. Real shoreline under the trees
Fig. 11. Height statistics of coarse riverbank contour
Fig. 12. Adaptive dynamic threshold correction
Fig. 13. Elevation histogram. (a) Single-peak elevation histogram; (b) bimodal elevation histogram
Fig. 14. Normal gradient constraint result. (a) Normal gradient constraint theory; (b) real shoreline under raster diagram; (c) real shoreline points in CloudCompare software
Fig. 15. Overlay of shoreline and imagery. (a) River shoreline map; (b) central island shoreline map;(c)overlapped map of extractive shoreline and actual shoreline
Fig. 16. Statistical histogram of error distribution extracted from the river edge. (a) Contour tracking method; (b) our method
Fig. 17. Extraction results comparison of our method and contour tracking method in different environments. (a) Extraction result of central island by contour tracking method; (b) extraction result of central island by our method; (c) extraction result of river bank by contour tracking method; (d) extraction result of river bank by our method
|
Table 1. River edge extraction error analysis table

Set citation alerts for the article
Please enter your email address
© Copyright 2018-2021 | Chinese Laser Press. All Rights Reserved 沪ICP备15018463号-20