
He Li, Suyu Li, Shuchang Li, Dunli Liu, Dan Tian, Anmin Chen, Ying Wang, Xiaowei Wang, Yunfeng Zhang, Mingxing Jin. Nitrogen fluorescence induced by the femtosecond intense laser pulses in air[J]. High Power Laser Science and Engineering, 2016, 4(1): 010000e7
- High Power Laser Science and Engineering
- Vol. 4, Issue 1, 010000e7 (2016)
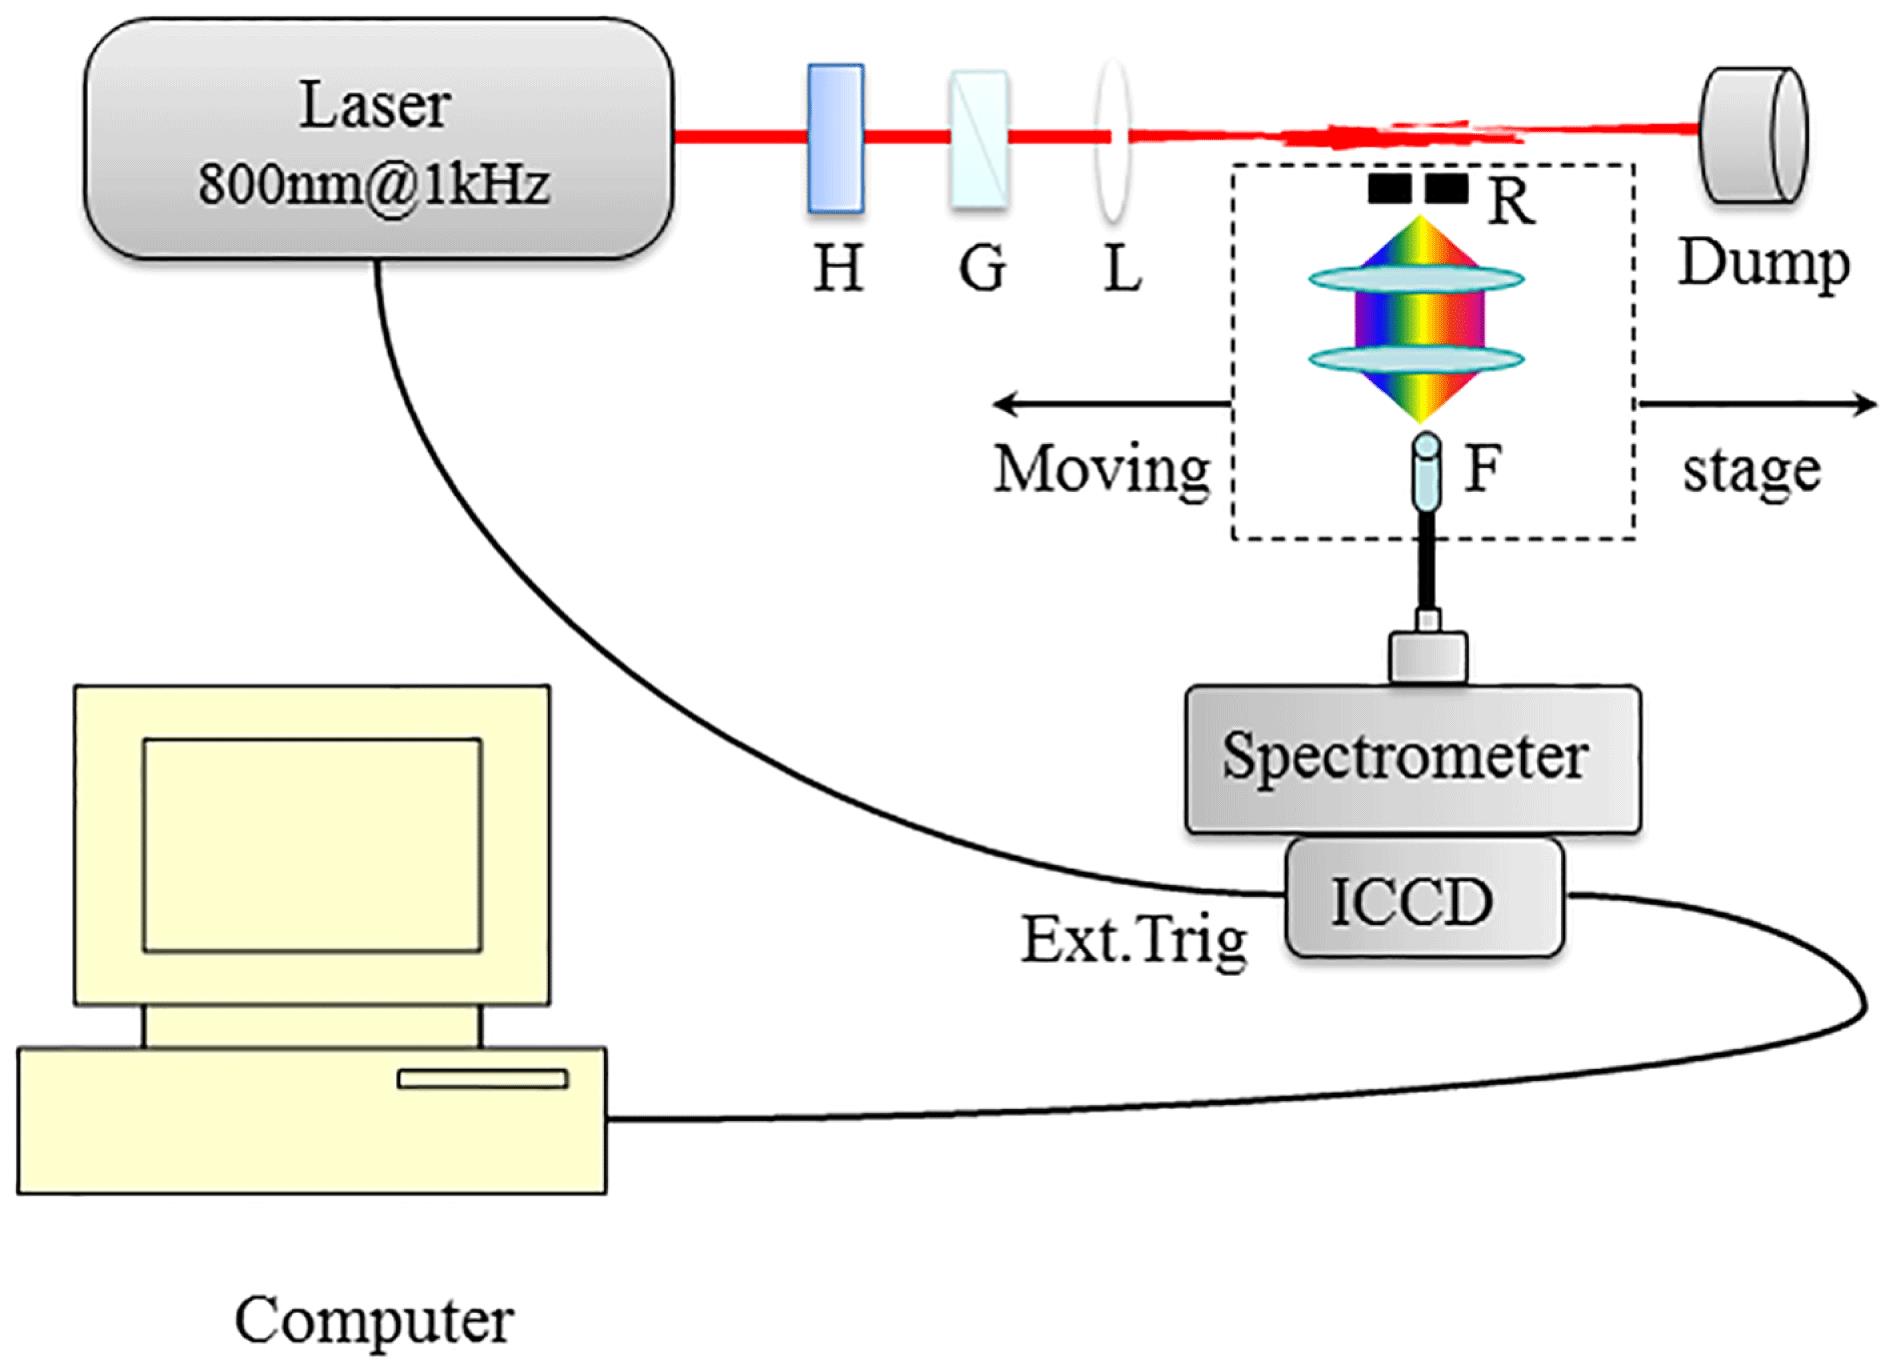
Fig. 1. Schematic of experimental setup to measure the plasma fluorescence generated during the femtosecond filamentation in air. G: Glan prism; H: half-wave plate; L: focusing lens; R: rectangular diaphragm; F: optical fibre.
![(a) Change of fluorescence spectra with the propagation distance $z$. (b) Fluorescence spectra measured as $z$ is 68 mm (solid black line), 78 mm (dash-dotted red line), and 94 mm (dotted blue line). The focal length is 100 cm and laser energy is 2.2 mJ. The pink words marked above the lines correspond to the signals from the second positive band system of N$_{2}$ ($C^{3}{\it\Pi}_{u}{-}B^{3}{\it\Pi}_{g}$ transition)[23–26]. In the transitions $v{-}v^{\prime }$, $v$ and $v^{\prime }$ denote the vibrational levels of upper and lower electronic states, respectively.](/richHtml/hpl/2016/4/1/010000e7/img_2.gif)
Fig. 2. (a) Change of fluorescence spectra with the propagation distance $z$ . (b) Fluorescence spectra measured as $z$ is 68 mm (solid black line), 78 mm (dash-dotted red line), and 94 mm (dotted blue line). The focal length is 100 cm and laser energy is 2.2 mJ. The pink words marked above the lines correspond to the signals from the second positive band system of N$_{2}$ ($C^{3}{\it\Pi}_{u}{-}B^{3}{\it\Pi}_{g}$ transition)[23–26]. In the transitions $v{-}v^{\prime }$ , $v$ and $v^{\prime }$ denote the vibrational levels of upper and lower electronic states, respectively.
Fig. 3. Change of 337, 357, and 380 nm spectral lines with $z$ . The focal length is 100 cm and laser energy is 2.2 mJ.
Fig. 4. (a) Variation of the spectrum intensity around 337 nm (332–341 nm) with $z$ as the pulse energy is different; (b) and (c) variation of the maximum intensity of spectral line at 337 nm with $z$ . The focal length is $f=100$ cm.
Fig. 5. Variation of collapse distance when focal length is (a) 100 and (b) 40 cm. The red circles are the experimental values, and the blue squares and green triangles refer to the collapse distance calculated from Marburger’s law (Equation (2 )) and revised Marburger’s law (Equation (3 )).
Fig. 6. (a) Variation of the spectrum intensity around 337 nm signal (332–341 nm) with $z$ ; (b) and (c) $z$ -evolution of the 337 nm signal. The focal length is 40 cm and the laser energy is changed from 0.4 to 3.1 mJ.
Fig. 7. Normalized spectrum intensity (a) at 35, 60, and 90 mm as the focal length $f$ is 100 cm and laser energy $E_{\text{in}}$ is 3.1 mJ; (b) as $f$ is 100 cm and $E_{\text{in}}$ is 0.7 mJ ($z=114$ mm), 1.9 mJ ($z=75$ mm), and 3.1 mJ ($z=60$ mm); (c) as $E_{\text{in}}$ is 3.1 mJ and the focal length is 100 ($z=60$ mm) and 40 cm ($z=16$ mm).

Set citation alerts for the article
Please enter your email address
© Copyright 2018-2021 | Chinese Laser Press. All Rights Reserved 沪ICP备15018463号-20