
Zihao Xia, Haolin Ding, Shihe Yi, "Inhibition of the aero-optical effects of supersonic mixing layers based on the RVGAs’ control," Chin. Opt. Lett. 21, 030102 (2023)
- Chinese Optics Letters
- Vol. 21, Issue 3, 030102 (2023)
Abstract
1. Introduction
The aero-optical effects (AOEs)[1–3] induced by the supersonic mixing layer structure, which often appear on the surface of a hyper/supersonic optical dome, have attracted a wide range of interest due to their adverse impacts on the imaging quality of infrared imaging windows. The supersonic mixing layers are formed between the surrounding atmosphere and the domes’ jet, which are usually used for wall cooling. The AOE is generally summarized as the beam’s jitter, blur, bore sight error (BSE), and attenuation of energy. Lawson et al.[4] found that the density fluctuation around the optical window of a hypersonic dome is mostly concentrated at the mixing and boundary layers. Spencer and Moore[5] came to similar conclusions: the supersonic mixing layer accounts for nearly 90% of the total AOE around a hypersonic dome. Therefore, finding an effective method to improve the supersonic mixing layer’s AOE is an indispensable and urgent need.
Traditional flow control devices include the oscillated flap[6], pulsed injection[7], electromagnetic actuator[8], cavity[9], triangular disturbance[10], lobed mixer[11], and so on. The main problem with those devices is that they mainly aim at enhancing the mixture of the supersonic mixing layer, which is not conducive to the reduction of the AOE.
Recently, some researchers have found that the ramp vortex generator (VG) is a possible way to realize this purpose. Zhu et al.[12] studied the AOE of supersonic cooling film over a backward-facing step with VGs at a Mach 3.4 wind tunnel. The optical path difference (OPD) was measured by the wavefront sensor based on the background-oriented schlieren (BOS). They found that the root mean square value of OPD (
Sign up for Chinese Optics Letters TOC. Get the latest issue of Chinese Optics Letters delivered right to you!Sign up now
Note that the above works focus on typical engineering structures, where the number of VG is only 2 to 3, which may not be enough to improve the whole optical performance of the cooling film. To put forward an in-depth understanding of VGs’ improvement on the AOE, we present a new flow control device based on the structure of the VG and name it the ramp vortex generator array (RVGA). The supersonic mixing layer is extracted from the engineering cooling film. The influence of the height of RVGA and pressure conditions of the wind tunnel on the supersonic mixing layer’s AOE is thoroughly studied by the nanotracer-based planar laser scattering (NPLS) technique and ray-tracing method. According to the experimental results, RVGA is a promising device that can reduce the thickness and mixture of the supersonic mixing layer, as well as the negative impact of AOE.
2. Experimental Facilities and Methods
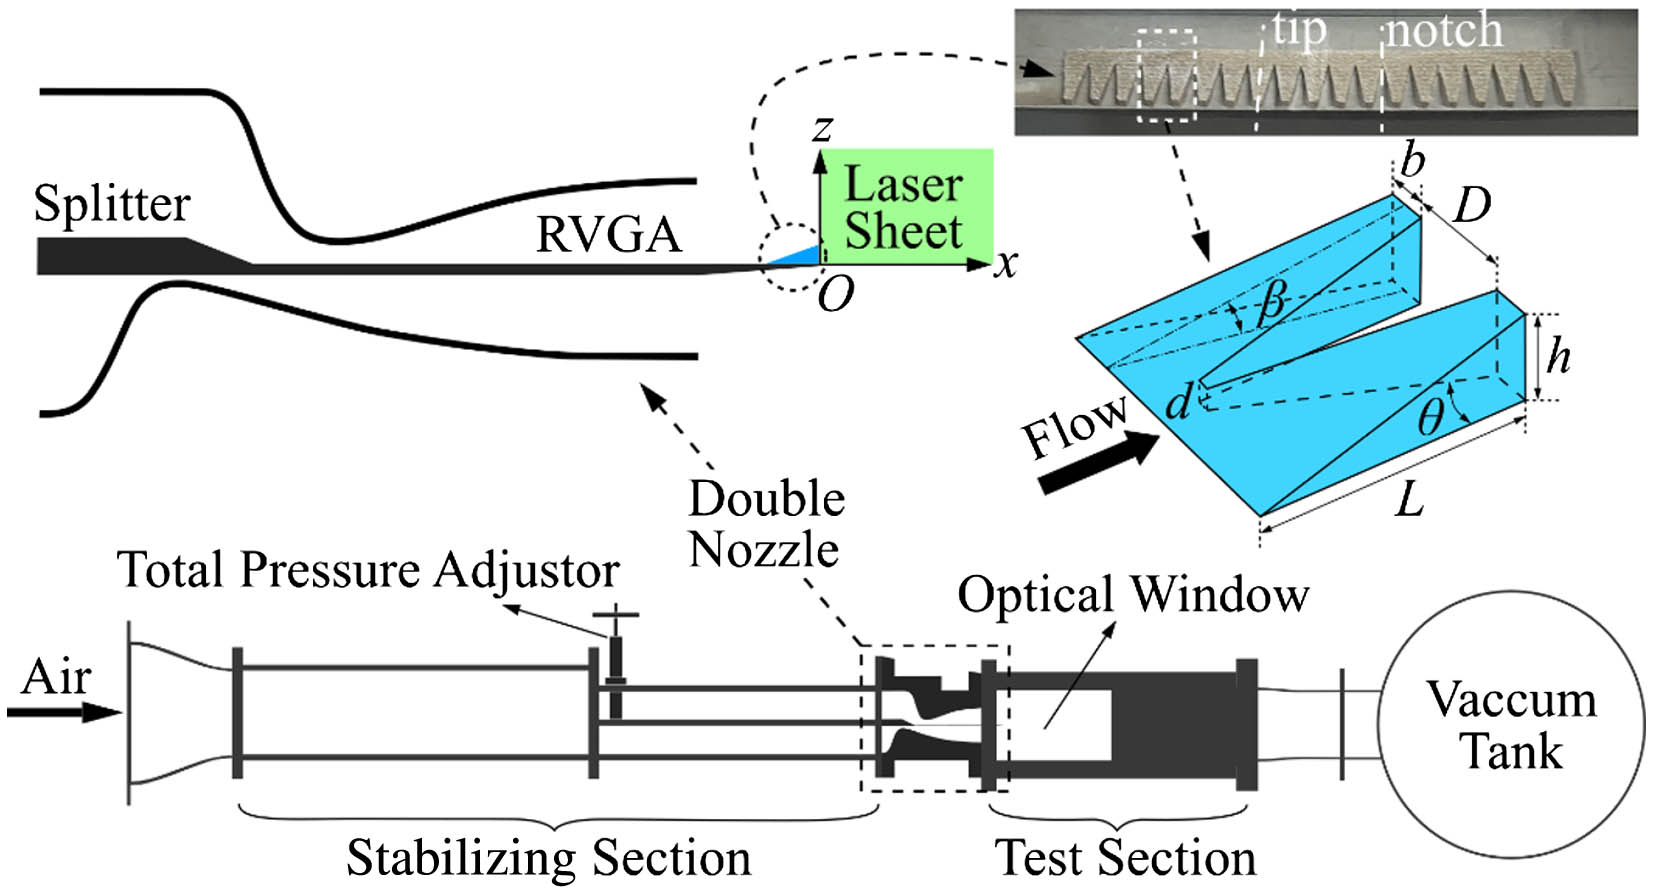
The experiments in this paper were conducted in an indraft supersonic mixing layer wind tunnel at the National University of Defense Technology. As shown in Fig. 1, the wind tunnel has a cross-section size of
| F1 | F2 | F1 | F2 | F1 | F2 | |
|---|---|---|---|---|---|---|
| Ma | 2.6 | 3.6 | 2.6 | 3.6 | 2.6 | 3.6 |
| 0.035 | 0.058 | 0.025 | 0.058 | 0.042 | 0.058 | |
| P0(kPa) | 16.4 | 101.0 | 11.8 | 101.0 | 19.9 | 101.0 |
| T0(K) | 303 | |||||
| Mc | 0.24 | |||||
Table 1. Wind Tunnel Operating Conditions
![]()
Figure 1.Supersonic mixing layer wind tunnel and the RVGA device.
The origin of the coordinates is chosen to be the center of the splitter’s trailing edge. The positive direction of the
The RVGA was mounted at the upper side of the splitter, and its trailing edge was aligned with that of the splitter. A total of three RVGAs with different heights were designed, and each RVGA had 19 tips, 18 notches, and 7 geometrical parameters.
| RVGA1 | 0.5 | 3.20 | 36.69 | ||||
| RVGA2 | 0.8 | 4.97 | 23.07 | 9.33 | 1.60 | 0.80 | 0.10 |
| RVGA3 | 1.2 | 7.37 | 15.50 |
Table 2. Geometric Parameters of the RVGA
The detailed flow structures of the mixing layers were captured by the NPLS technique, which is a nonintrusive fine flow field testing technique with a high spatiotemporal resolution and has been widely used in flow visualization of supersonic flow fields[14–17]. Figure 2 shows the NPLS system’s layout. The CCD camera with
![]()
Figure 2.Schematic diagram of the NPLS system.
The density fields of the mixing layer were then acquired by the NPLS-based density measurement technique[18]. Once the density fields are known, we can get the refractive index fields
To explain the difference in OPD between various experiments, the Sutton linking equation[19] is applied as
In Eq. (4), rms means the root mean square value,
3. Results and Discussions
The typical NPLS results (resolution 105 µm/pixel) of supersonic mixing layers with/without RVGA control at different RSP conditions are shown in Fig. 3; the shooting range is
![]()
Figure 3.NPLS images of supersonic mixing layers.
To evaluate the AOE of different cases, we chose a beam with a wavelength of 532 nm and let it traverse through the flow field from
![]()
Figure 4.Mean and standard deviation values of
With or without RVGA control, it is found that the
In order to explain these phenomena, the NPLS images are divided into 10 uniform parts along the streamwise direction to calculate the corresponding
![]()
Figure 5.Distribution of density fluctuation and its correlation length along the streamwise direction.
The work above proves that RVGA is a useful tool in controlling the
4. Conclusions
In conclusion, we have developed a flow control device (RVGA) based on the ramp VG. Three RVGAs are successfully applied to mitigate the AOE induced by supersonic mixing layers (
References
[1] H. L. Ding, S. H. Yi, Y. Xu, X. H. Zhao. Recent developments in the aero-optical effects of high-speed optical apertures: From transonic to high-supersonic flows. Prog. Aerosp. Sci., 127, 100763(2021).
[2] G. M. Guo, H. Liu, B. Zhang. Aero-optical effects of an optical seeker with a supersonic jet for hypersonic vehicles in near space. Appl. Opt., 55, 4741(2016).
[3] E. J. Jumper, E. J. Fitzgerald. Recent advances in aero-optics. Prog. Aerosp. Sci., 37, 299(2001).
[4] S. M. Lawson, R. L. Clark, M. R. Banish, R. F. Crouse. Wave-optic model to determine image quality through supersonic boundary and mixing layers. Proc. SPIE, 1488, 268(1991).
[5] A. Spencer, W. Moore. Design trade-offs for homing missiles. Annual Interceptor Technology Conference(1992).
[6] L. Chew, W. Christiansen. Coherent structure effects on the optical performance of plane shear layers. AIAA J., 29, 76(1991).
[7] A. D. Cutler, G. C. Harding, G. S. Diskin. High frequency supersonic pulsed injection. Annual Interceptor Technology Conference(2001).
[8] D. K. McLaughlin, S. Martens, K. W. Kinzie. An experimental investigation of large scale instabilities in a low Reynolds number two-stream supersonic shear layer. Annual Interceptor Technology Conference(1992).
[9] A. Zang, T. Tempel, K. Yu, S. G. Buckley. Experimental characterization of cavity-augmented supersonic mixing. Annual Interceptor Technology Conference(2005).
[10] S. Watanabe, M. G. Mungal. Velocity field measurements of mixing-enhanced compressible shear layers: effects of disturbance configuration. Annual Interceptor Technology Conference(2000).
[11] D. D. Zhang, J. G. Tan, J. W. Hou. Structural and mixing characteristics influenced by streamwise vortices in supersonic flow. Appl. Phys. Lett., 110, 124101(2017).
[12] Y. Z. Zhu, S. H. Yi, H. L. Ding, W. S. Nie, Z. W. Zhang. Structures and aero-optical effects of supersonic flow over a backward facing step with vortex generators. Eur. J. Mech. B Fluids, 74, 302(2019).
[13] H. L. Ding, S. H. Yi, X. H. Zhao, H. X. Xiong, T. C. Ouyang. Experimental investigation on aero-optical mitigation of hypersonic optical dome using microvortex generators. AIAA J., 57, 2653(2019).
[14] Y. X. Zhao, S. H. Yi, L. F. Tian, Z. Y. Cheng. Supersonic flow imaging via nanoparticles. Sci. China Technol. Sci., 52, 3640(2009).
[15] H. L. Ding, S. H. Yi, T. C. Ouyang, Y. X. Zhao. Research on velocity measurements of the hypersonic turbulent boundary layer based on the nano-tracer-based planar laser scattering technique. Meas. Sci. Technol., 31, 085302(2020).
[16] X. Liu, S. Yi, X. Xu, Y. Shi, T. Ouyang, H. Xiong. Experimental study of second-mode wave on a flared cone at Mach 6. Phys. Fluids, 31, 074108(2019).
[17] D. Gang, S. Yi, Q. Mi. MHz rate flow visualization of the evolution of supersonic compressible mixing layer. J. Vis., 25, 1117(2022).
[18] L. F. Tian, S. H. Yi, Y. X. Zhao, L. He, Z. Y. Cheng. Study of density field measurement based on NPLS technique in supersonic flow. Sci. China Phys. Mech. Astron., 52, 1357(2009).
[19] H. L. Ding, S. H. Yi, X. H. Zhao, J. R. Yi, L. He. Research on aero-optical prediction of supersonic turbulent boundary layer based on aero-optical linking equation. Opt. Express, 26, 31317(2018).


Set citation alerts for the article
Please enter your email address

© Copyright 2018-2021 | Chinese Laser Press. All Rights Reserved 沪ICP备15018463号-20