
Wenxin Zhang, Yuxiu Tao, Yangkang Wu, Fu Zhu, Wenchao Cai, Ning Liu, Qiang Zhao, Ping Xue, "Vibration measurement with frequency modulation single-pixel imaging," Chin. Opt. Lett. 21, 011102 (2023)
- Chinese Optics Letters
- Vol. 21, Issue 1, 011102 (2023)
Abstract
1. Introduction
Single-pixel imaging can reconstruct the 2D image of the object when the light traveling from the object to the detector is scattered or distorted, so it is widely used in some complicated situations, such as in smoke, turbulence, or water where other optical methods cannot implement imaging. It has huge potential in defense and civil and has became a research hotspot in the field of optical imaging recently. Single-pixel imaging is often referred to ghost imaging[1], especially computational ghost imaging[2], because both of them illuminate the object with light patterns and use a single-pixel detector to detect the scattered light from the object[3]. At first, ghost imaging was more popular, but it has the problem of extremely low imaging signal-to-noise ratio (SNR)[4]. Compared to computational ghost imaging, where the light patterns are random, single-pixel imaging usually has better SNR by designing the light patterns carefully[5].
Several methods were developed to improve the SNR of single-pixel imaging and ghost imaging, such as differential ghost imaging[6], iterative algorithm[7,8], Gerchberg–Saxton-like single-pixel image[9], and imaging of a reflective object using positive and negative correlations[10]. Compared to the methods above, single-pixel imaging that used special light patterns has obvious advantages in SNR, for example, the compressive sensing computational single-pixel imaging method[11,12], Fourier spectrum retrieval method[13], and Fourier spectrum acquisition method[3]. All these methods greatly improve the SNR and make single-pixel imaging more suitable for use.
Some methods can obtain extra information. The colored object encoding scheme was used in single-pixel imaging systems to get the color of the object[14], and the polarimetric single-pixel imaging method can be used to obtain polarization information[15]. However, we still cannot get the vibration information when the object is vibrating during the measurement, and the single-pixel image will also blur.
Sign up for Chinese Optics Letters TOC. Get the latest issue of Chinese Optics Letters delivered right to you!Sign up now
2. Theory
In this Letter, we use a method called frequency modulation single-pixel imaging (FMSI) to detect the vibration of the object. FMSI uses a light source with a special pattern to illuminate the object, which can ensure that the light intensity signals at different positions have different frequencies. When the object is vibrating, there will be an extra intensity modulation on the light, and the frequency of the position will be changed. By analyzing the change of the frequency, we can obtain the information of the position and frequency of the vibration. By getting the vibration information, FMSI has the potential to finding abnormal conditions such as hidden facilities under construction or unexpected instruments in work.
![]()
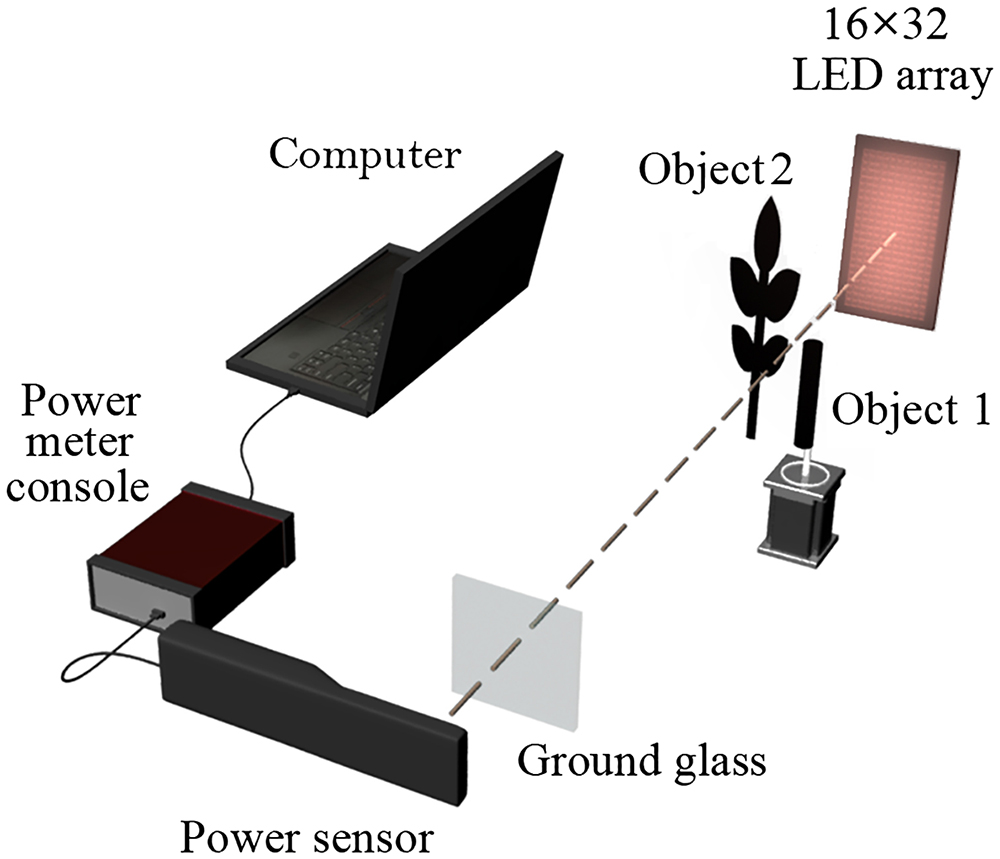
Figure 1.Optical design of FMSI. The light-emitting diode (LED) array is 32 × 16 pixels, and each pixel is 5 mm × 5 mm. Power sensor: S130C, Thorlabs; power meter console: PM100USB, Thorlabs.
The optical design of FMSI is shown in Fig. 1. An LED array is used as a light source to illuminate the object. The distance between the objects and LED array is 2 cm, and the distance between the objects and sensor is about 40 cm. The pattern of the LED is well designed, and the light pattern on the sample is almost the same as the LED pattern because the distance between the object and sample is quite small. If the distance becomes large, the lights from different LEDs will mix with each other, and the final image will blur. The image we finally obtain is the convolution of the pattern of the object and point spread function (PSF), which can be obtained by the light intensity distribution function on the object of a single superluminescent diode (SLD). In this circumstance, a lens can be placed between the light source and object to project the pattern of the light source onto the object to reduce PSF. The light pattern on the sample has sequence intensity distribution
As the objects have different transmittance, part of the light passes through the object and finally enters the power sensor. As single-pixel imaging is usually used in complicated situations where there are obstacles or distortions which will disturb the light from the object between the detector and the object, a piece of ground glass is placed before the detector as a barrier to distort the light. Of course, we can still obtain the image without the ground glass, and the image will be even better because the power sensor receives more light.
When the sequence light intensity pattern
In order to distinguish information from different positions and get the vibration information, we should make the sequence light intensity signals at different positions orthogonal to each other. As the trigonometric function is one of the most commonly used and most compact orthogonal functions, we use it to modulate the light. We make the light intensity signals at different positions have different frequencies, and the light intensity distribution at position
The light then passes through the object and ground glass and reaches the detector. The signal at the detector is
From Eq. (2), we can see that when the object is stable, the sequence signal at the detector is the sum of a constant and the cosine transformation of the transmittance distribution function
When the object is vibrating, as long as there is a vibration component perpendicular to the propagation direction of the light, the transmittance at the edge of the object will change with time.
The transmittance at the edge of the object can be written as
The sequence signal at the detector will also be changed,
By doing cosine transformation of the signal
The first term appears at the same position when the object is stable. The second and third terms distribute symmetrically on both sides of the vibration frequency.
In order to avoid the signals overlapping with each other, the position of the vibration signal with smaller frequency should be larger than that of the signal of the stable object. So, we should have
3. Simulation
The simulations of the vibration measurement with FMSI are shown in Fig. 2. When all the objects are stable, FMSI can retrieve the image perfectly, as shown in Figs. 2(b) and 2(c). When object 1 is vibrating, the edge of the object will blur, as shown in Fig. 2(e), a signal appears at the vibration frequency, and the signal of the edge of the object appears at both sides of the vibration signal, as shown in Fig. 2(e). In Fig. 2(f), the position of the vibrating object can be found by the edge of the object.
![]()
Figure 2.Simulations of the vibration measurement with FMSI. (a) The original binary sample (64 × 64), (b) Fourier transformation of the signal when all the objects are stable, (c) single-pixel image when all the objects are stable, (d) Fourier transformation of the signal when object 1 is vibrating horizontally, (e) single-pixel image when object 1 is vibrating horizontally, and (f) single-pixel image of vibrating area.
In fact, the amplitude of the vibration may not be less than the size of one pixel. If the amplitude is larger than one pixel, the frequency distribution of the transmittance will change.
Simulations when the amplitude of the vibration is larger than one pixel are shown in Fig. 3. When the amplitude is 1.6 times the length of the pixel and the edge of the object is vibrating between pixel 1 and pixel 2, the transmittance of each pixel is shown in Figs. 3(b) and 3(c). By Fourier transformation, we can see that the harmonics appear. Fortunately, the frequency of the vibration is the same as the base frequency, and the signal of harmonics and the vibration object will not overlap with each other due to Eq. (10).
![]()
Figure 3.Frequency distribution of transmittance when the amplitude of the vibration is larger than one pixel. (a) The edge of the object vibrating between pixel 1 and pixel 2. Pixel 1 and pixel 2 are the two pixels affected by the vibration edge, where the amplitude of the vibration is 1.6 times the length of the pixel. (b) and (c) Change of transmittance at the pixel 1 and pixel 2, (d) frequency of the vibration, (e) and (f) frequency of transmittance of pixel 1 and pixel 2.
4. Experiment
A stable leaf and a vibrating cylinder are used as samples to further experimentally verify the feasibility of FMSI to measure vibration. We use a
![]()
Figure 4.Experiments of the vibration measurement with FMSI. The signals of the stable object and vibrating object, and mirror signal are shown.
![]()
Figure 5.Experiments of the vibration measurement with FMSI. (a) Fourier transformation of the signal when all the objects are stable, (b) single-pixel image when all the objects are stable, (c) single-pixel image of the same area as (f), (d) Fourier transformation of the signal when the cylinder is vibrating horizontally, (e) single-pixel image when the cylinder is vibrating horizontally, and (f) single-pixel image of the vibrating area.
The experiment results of single-pixel imaging are shown in Figs. 4 and 5. The Nyquist sampling rule requires twice the highest frequency of the signal of sample. If all the object is stable, the highest frequency from the object is
But, if we want to detect the vibration, the highest frequency we need becomes larger. The largest frequency is
In our experiment, the highest frequency of the light source is
As shown in Figs. 5(b) and 5(c), when all the objects are stable, FMSI can retrieve the image perfectly, and no vibration signal appears. When the cylinder is vibrating, the edge of the object will blur, as shown in Fig. 5(e), and the vibration signal and the signals of the edge of the object appear, as shown in Figs. 5(d) and 5(f).
The vibration signal appears at
What should be emphasized is that other orthogonal functions can also reconstruct the image, but that will be complex. With trigonometric function modulation, at the edge of the vibrating object, the intensity of transmitted light is transmittance multiplied by the intensity of light shining on that location. The signals with a difference and sum of their frequencies are produced. So, we can obtain the structure and vibration information of the object by a signal Fourier transformation, which is quite a simple process.
Also, as we use trigonometric function modulation, the signal of environmental light, especially the signal of electric light, may affect our result, for which their frequency is usually 50 Hz or its integer multiples. In this circumstance, we can remove these signals of particular frequencies in image processing or choose the appropriate frequency of the light source to avoid this disturbance.
5. Conclusion
We introduce a method to obtain vibration information with the FMSI method. This method uses a light source with a special pattern to illuminate the object, which can ensure that the light intensity signals at different positions have different frequencies. When the object has an in-plane vibration component, by analyzing the total light intensity signal transmitted or reflected by the sample, the position of the vibrating object and the vibration frequency can be obtained. By getting the vibration information, FMSI has the potential to finding the occurrence of abnormal conditions accompanied by unexpected vibration. Also, in addition to being able to measure vibration, FMSI has a similar SNR to other high-SNR single-pixel imaging methods[4].
References
[1] T. Pittman, Y. Shih, D. Strekalov, A Sergienko. Optical imaging by means of two-photon quantum entanglement. Phys. Rev. A, 52, R3429(1995).
[2] H. Shapiro. Computational ghost imaging. Phys. Rev. A, 78, 061802(2008).
[3] Z. Zhang, X. Ma, J. Zhong. Single-pixel imaging by means of Fourier spectrum acquisition. Nat. Commun., 6, 6225(2015).
[4] R. Meyers, S. Deacon, Y. Shih. Ghost-imaging experiment by measuring reflected photons. Phys. Rev. A, 77, 041801(2008).
[5] G. Winters, R. Bartels. Two-dimensional single-pixel imaging by cascaded orthogonal line spatial modulation. Opt. Lett., 40, 2774(2015).
[6] F. Ferri, D. Magatti, L. A. Lugiato, A. Gatti. Differential ghost imaging. Phys. Rev. Lett., 104, 253603(2010).
[7] W. Wang, Y. Wang, J. Li, X. Yang, Y. Wu. Iterative ghost imaging. Opt. Lett., 39, 5150(2014).
[8] G. Li, Z. Yang, R. Yan, A. Zhang, L. Wu, S. Qu, X. Zhang. Iterative normalized correspondence ghost imaging. Optik, 161, 20(2018).
[9] W. Wang, X. Hu, J. Liu, S. Zhang, J. Suo, G. Situ. Gerchberg-Saxton-like ghost imaging. Opt. Express, 23, 28416(2015).
[10] M. Sun, M. Li, L. Wu. Nonlocal imaging of a reflective object using positive and negative correlations. App. Opt., 54, 7494(2015).
[11] V. Katkovnik, J. Astola. Compressive sensing computational ghost imaging. J. Opt. Soc. Am. A, 29, 1556(2012).
[12] O. Katza, Y. Bromberg, Y. Silberberg. Compressive ghost imaging. Appl. Phys. Lett., 95, 131110(2009).
[13] Y. Xiao, L. Zhou, W. Chen. Fourier spectrum retrieval in single-pixel imaging. IEEE Photonics J., 11, 7800411(2019).
[14] Y. Li, H. Yang, J. Liu, L. Gong, Y. Sheng, W. Cheng, S. Zhao. Colored object encoding scheme in ghost imaging system using orbital angular momentum. Chin. Opt. Lett., 11, 021104(2013).
[15] D. Shi, S. Hu, Y. Wang. Polarimetric ghost imaging. Opt. Lett., 39, 1231(2014).


Set citation alerts for the article
Please enter your email address

© Copyright 2018-2021 | Chinese Laser Press. All Rights Reserved 沪ICP备15018463号-20