Author Affiliations
1School of Geography and Tourism, Chongqing Normal University, Key Laboratory of GIS Application, Chongqing Municipal Education Commission, Chongqing 401331, China2Institute of Glaciology and Ecogeography, College of Earth and Environmental Sciences, Lanzhou University, Lanzhou 730000, China3Chongqing Comprehensive Economic Research Institute, Chongqing 401147, Chinashow less
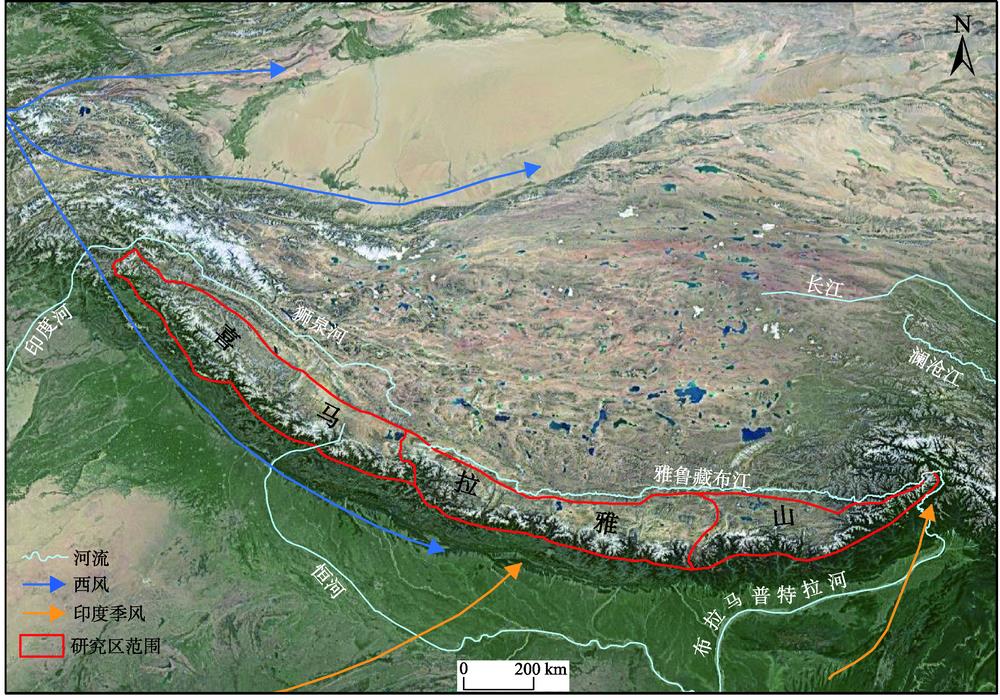
Fig. 1. Location of the study area (Himalayas)
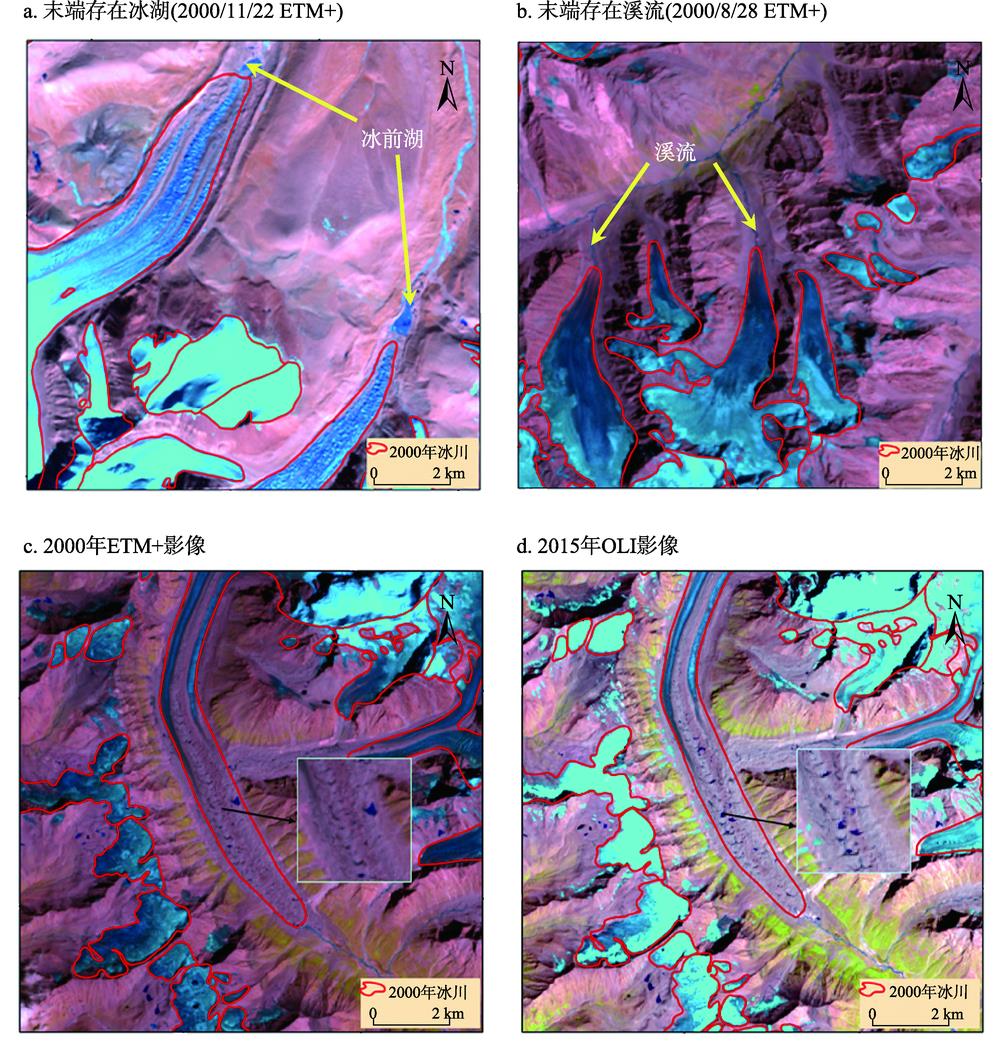
Fig. 2. The extraction of debris-covered glaciers
Fig. 3. Glacier boundary and GPS measuring points of Zhongni Glacier
Fig. 4. Glacier changes of the Himalayas in 1990-2015 (background is Landsat ETM+ image)
Fig. 5. The annual average retreat rate of glaciers in the eastern, middle and western parts of the Himalayas during1990-2015
Fig. 6. Distribution and retreat of glaciers in different aspects from 1990 to 2015
Fig. 7. Coverage and retreat of glaciers on different slopes from 1990 to 2015
| 获取日期 | 传感器 | 云量(%) | 获取日期 | 传感器 | 云量(%) | 获取日期 | 传感器 | 云量(%) | 获取日期 | 传感器 | 云量(%) |
|---|
| 149/36 | 1990/08/07 | TM | 44 | 2001/08/29 | ETM+ | 17 | 2008/07/31 | ETM+ | 15 | 2016/10/01 | OLI | 1 | | 148/36 | 1991/09/20 | TM | 53 | 2000/08/27 | TM | 10 | 2008/08/25 | ETM+ | 12 | 2016/10/02 | ETM+ | 1 | | 148/37 | 1991/09/20 | TM | 34 | 2000/09/04 | ETM+ | 23 | 2008/08/25 | ETM+ | 23 | 2015/09/14 | ETM+ | 29 | | 147/37 | 1991/08/28 | TM | 64 | 2000/08/28 | ETM+ | 24 | 2008/08/25 | ETM+ | 51 | 2016/10/03 | OLI | 1 | | 147/38 | 1989/08/06 | TM | 25 | 2001/09/24 | TM | 1 | 2011/09/28 | ETM+ | 25 | 2015/09/15 | OLI | 7 | | 146/38 | 1992/11/11 | TM | 1 | 2001/09/09 | ETM+ | 2 | 2008/07/28 | ETM+ | 18 | 2015/09/16 | ETM+ | 2 | | 146/39 | 1992/11/11 | TM | 8 | 2000/08/05 | ETM+ | 13 | 2011/12/26 | ETM+ | 0 | 2016/11/13 | OLI | 10 | | 145/38 | 1990/11/15 | TM | 3 | 2000/11/02 | ETM+ | 2 | 2009/07/30 | TM | 21 | 2015/09/17 | OLI | 3 | | 145/39 | 1990/11/15 | TM | 1 | 2001/08/01 | ETM+ | 26 | 2011/09/22 | TM | 30 | 2016/12/08 | OLI | 1 | | 144/39 | 1991/12/13 | TM | 42 | 1999/12/03 | TM | 17 | 2011/10/09 | ETM+ | 2 | 2015/09/10 | OLI | 3 | | 143/39 | 1988/12/13 | TM | 3 | 2000/10/03 | ETM+ | 1 | 2011/10/18 | ETM+ | 2 | 2015/09/03 | OLI | 3 | | 143/40 | 1988/10/26 | TM | 13 | 2001/12/09 | ETM+ | 16 | 2011/12/05 | ETM+ | 37 | 2015/09/27 | ETM+ | 32 | | 142/40 | 1991/10/12 | TM | 0 | 2000/12/15 | ETM+ | 2 | 2009/09/27 | TM | 23 | 2015/10/06 | ETM+ | 1 | | 141/40 | 1988/12/15 | TM | 2 | 2000/11/22 | ETM+ | 1 | 2010/12/12 | TM | 24 | 2015/10/07 | OLI | 3 | | 140/40 | 1989/11/09 | TM | 1 | 2000/11/15 | TM | 0 | 2009/11/08 | ETM+ | 1 | 2015/09/30 | OLI | 3 | | 140/41 | 1989/11/09 | TM | 1 | 1999/04/27 | TM | 27 | 2012/12/02 | ETM+ | 1 | 2015/10/08 | ETM+ | 1 | | 139/40 | 1990/06/14 | TM | 0 | 2001/12/29 | ETM+ | 1 | 2010/04/18 | TM | 8 | 2015/10/09 | OLI | 1 | | 139/41 | 1990/06/14 | TM | 42 | 2000/12/26 | ETM+ | 1 | 2012/10/08 | ETM+ | 18 | 2015/10/09 | OLI/TIRS | 17 | | 138/40 | 1990/01/14 | TM | 1 | 2000/12/19 | ETM+ | 1 | 2009/01/04 | TM | 1 | 2015/09/08 | ETM+SLC-off | 11 | | 138/41 | 1990/10/16 | TM | 24 | 1999/09/20 | TM | 32 | 2008/01/16 | TM | 13 | 2015/09/08 | ETM+SLC-off | 55 | | 137/40 | 1988/09/30 | TM | 24 | 1999/05/08 | TM | 0 | 2009/11/11 | TM | 0 | 2015/09/09 | OLI | 2 | | 137/41 | 1988/09/30 | TM | 16 | 2000/12/28 | ETM+ | 0 | 2011/09/30 | TM | 8 | 2016/09/09 | OLI | 36 | | 136/40 | 1988/10/09 | TM | 24 | 1998/12/08 | TM | 11 | 2009/11/04 | TM | 14 | 2015/11/21 | OLI | 1 | | 136/41 | 1990/06/25 | TM | 24 | 2001/01/30 | TM | 21 | 2009/11/04 | TM | 5 | 2015/11/21 | OLI | 1 |
|
Table 1. Utilized image data
| 年份 | 面积(km2) | 减少量(km2) | 退缩率(%) | 年均变化率(%/a) |
|---|
| 1990 | 23229.27±997.28 | - | - | - | | 2000 | 22338.25±981.83 | 891.02±15.45 | 3.84±0.07 | -0.38±0.007 | | 2010 | 21438.14±959.61 | 900.11±22.22 | 4.03±0.10 | -0.40±0.010 | | 2015 | 20676.17±944.28 | 761.97±15.33 | 3.55±0.07 | -0.71±0.007 | | 总计/平均值 | - | 2553.10±53.00 | 10.99±0.23 | -0.44±0.014 |
|
Table 2. Glacier area variations in 1990-2015
| 年份 | 1990 | 2000 | 2010 | 2015 |
|---|
| 西段 | 11551.69±546.82 | 11117.70±541.50 | 10671.78±529.02 | 10242.10±518.95 | | 中段 | 8584.75±332.91 | 8267.95±324.35 | 7953.78±316.43 | 7711.22±313.46 | | 东段 | 3092.83±117.55 | 2952.60±115.98 | 2812.58±114.16 | 2722.85±111.87 | | 总计 | 23229.27±997.28 | 22338.25±981.83 | 21438.14±959.61 | 20676.17±944.28 |
|
Table 3. Distribution characteristics of glaciers in the eastern, central and western parts in the Himalayas from 1990 to 2015
| 年份 | 面积(km2) | 减少量(km2) | 退缩率(%) | 年均变化率(%/a) |
|---|
| 1990 | 14451.25±583.40 | - | - | - | | 2000 | 13973.83±572.00 | 477.42±11.40 | 3.30±0.08 | -0.33±0.008 | | 2010 | 13542.04±562.26 | 431.79±9.74 | 3.09±0.07 | -0.31±0.007 | | 2015 | 13082.14±555.72 | 459.90±6.54 | 3.40±0.05 | -0.68±0.010 | | 总计 | - | 1369.11±27.68 | 9.47±0.19 | -0.38±0.013 |
|
Table 4. Ice covered area and variations of the southern Himalayas from 1990 to 2015
| 年份 | 面积(km2) | 减少量(km2) | 退缩率(%) | 年均变化率(%) |
|---|
| 1990 | 8778.02±413.88 | - | - | - | | 2000 | 8364.42±409.83 | 413.60±4.05 | 4.71±0.05 | -0.47±0.005 | | 2010 | 7896.10±397.35 | 468.32±12.48 | 5.60±0.15 | -0.56±0.015 | | 2015 | 7594.03±388.56 | 302.07±8.79 | 3.83±0.11 | -0.77±0.022 | | 总计 | - | 1183.99±25.32 | 13.49±0.29 | -0.54±0.019 |
|
Table 5. Ice covered area and variations of the northern Himalayas for 1990-2015
| 年份 | 表碛覆盖 | | 非表碛覆盖 |
|---|
| 面积(km2) | 数目 | 规模(km2) | 面积(km2) | 数目 | 规模(km2) |
|---|
| 1990 | 10269.37±303.66 | 749 | 13.71±0.41 | | 12959.90±693.62 | 11462 | 1.13±0.06 | | 2015 | 9733.22±298.79 | 754 | 12.91±0.40 | 10942.95±645.49 | 12004 | 0.91±0.05 |
|
Table 6. Area and change of glaciers in situations of Himalayas during the period of 1990-2015
| 年份 | 面积(km2) | 减少量(km2) | 退缩率(%) | 年均变化率(%/a) |
|---|
| 1990 | 2116.69±158.95 | - | - | - | | 2000 | 2036.04±154.10 | 80.65±4.85 | 3.81±0.23 | -0.38 | | 2010 | 1996.60±151.04 | 39.44±3.06 | 1.94±0.15 | -0.19 | | 2015 | 1959.20±148.27 | 37.40±2.77 | 1.87±0.14 | -0.37 | | 总计/平均值 | - | 157.49±10.68 | 7.44±0.50 | -0.30 |
|
Table 7. Debris covered area and changes in the Himalayas during the period of 1990-2015