1Institute of Plasma Physics, Chinese Academy of Sciences, Hefei 230031, China
2School of Nuclear Science and Technology, University of Science and Technology of China, Hefei 230026, China
3Key Laboratory of Atmospheric Composition and Optical Radiation, Anhui Institute of Optics and Fine Mechanics, Chinese Academy of Sciences, Hefei 230031, China
Yingying Li, Xianghui Yin, Bangxin Wang, Yi Zhang, Jia Fu, Bo Lv. Design of filter spectroscopy for the measurement of plasma ion temperature and rotation on the Experimental Advanced Superconducting Tokamak tokamak[J]. Chinese Optics Letters, 2015, 13(Suppl.): S21202
Copy Citation Text
A new filter spectrometer for the simultaneous measurement of plasma ion temperature and rotation velocity on the experimental advanced superconducting tokamak is proposed. The Doppler broadening and Doppler shift of the plasma spectral line is determined by the signal intensity ratio of the three-filter channels that have different peak wavelengths. A rapid calculated algorithm of the temperature and rotation velocity is presented. This filter spectrometer will allow researchers to measure spectra with a temperature and velocity range of 0.1–5 keV and to 250 km/s, respectively.
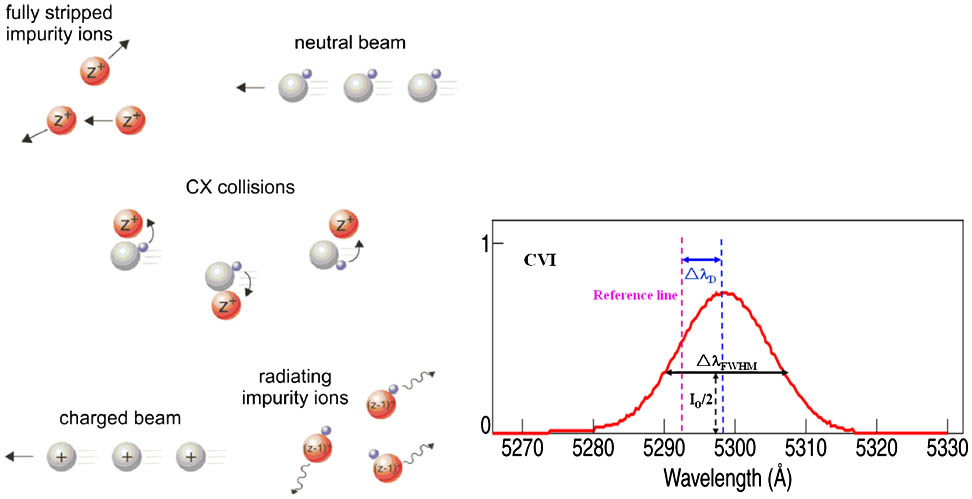
Charge exchange recombination spectroscopy (CXRS) is commonly used for the measurement of plasma ion temperature, rotation velocity, impurity density, and the radial electric field from the ion pressure balance equation[1–5] in almost all of the exiting tokamaks. The basic physics of the CXRS diagnostics is based on the charge transfer from the beam atom to the fully stripped low- impurity ion by the following two-step reaction (shown in Fig. 1) where denotes the injected neutral beam species[6,7] and is the fully stripped low- impurity ion. When a charge-exchange reaction occurs, the resultant ion is usually in an excited state and subsequently decays to the lower state by emitting a photon with the energy , where is Planck’s constant and is velocity, which can be analyzed by the spectral method. Most commonly, charge exchange emission from the () transition of (hydrogen-like)[8,9] is used. The main advantage of using the carbon emission is the relatively clean spectrum and its abundance as the main impurity species due to the commonly used carbon-based first wall materials in most tokamaks.
Figure 1.Schematic for the principle of the charge exchange recombination (left). Right, CXRS spectrum; Doppler shift (), width (), and intensity of the spectral line give information on the rotation velocity, temperature, and density of the observed species. Remainder, reference wavelength of CVI () is 529.05 nm.
The ion temperature and the plasma velocity are determined from the Doppler broadening and Doppler shift of the measured spectral lines. To achieve a temporally and spatially resolved measurement, the standard spectrometry for the CXRS utilizes the grating spectrometers equipped with two-dimensional (2D) charge-coupled device (CCD) cameras. The minimum time resolution is then on the order of tens of milliseconds, limited by the vertical shift speed, the pixel readout rate, and the dimension of the chip of the CCD camera. In order to investigate the fast physical phenomena of the experimental advanced superconducting tokamak (EAST) plasma[10], such as the low (L) to high (H) transition, the edge-localized modes (ELMs)[11,12], and so on, a new filter spectrometer is being developed to achieve higher temporal resolution.
On the EAST tokamak, the light emitted from the beam–plasma interaction zone is normally collected by the collection optics and then transferred via the fiber bundles towards the common spectrometers behind the EAST hall for spectral analysis[5]. The light collection for the filter spectrometer will use the existing input optics and one fiber bundle. A schematic optical layout of the filter spectrometer is presented in Fig. 2. The main components consist of a quartz fiber bundle, a collimation lens, beam splitters, three interference filters, and a macrolens mounted in front of the high-sensitivity photomultipliers (PMTs). In order to maximize the light intensity, the light of the four fibers from the same viewing radius of the EAST plasma[5] is integrated together, and the fibers are packed into a circle as one channel. The collimating lens is used to generate parallel light and matches with the input fiber optic, and the one-third and one-half beam splitters divide the same proportion of light onto the three individual channels. All the splitter elements are positioned on a multi-axis optical stage for accurate alignment.
Sign up for Chinese Optics Letters TOC. Get the latest issue of Chinese Optics Letters delivered right to you!Sign up now
Figure 2.Top view of the filter spectrometer optical layout. Designed center wavelength for the three filters (Channel 3) is 529.55 nm, the tilt angle of the silica filter for the two short wavelength (529.05 and 528.55 nm; Channels 2 and 1, respectively) is about 3.6° and 5.1°, respectively.
The filter is one of the key parts. The spectral transmission of the filter used is usually affected by the incident angle of the light to the filter and the ambient temperature. The decrease in the central wavelength is a function of the refractive indices of the deposited films and the angle of incidence. For the collimated radiation with an incident angle , the shift in the peak wavelength is given by[13]where is the central wavelength at an incidence angle, is the central wavelength at the normal incidence (), is the refractive index for the medium surrounding the filter (), and is the effective refractive index of the filter.
In order to control the incident angle between the light and the filter, a high-precision rotary table from JinHang Precision Bearing Co., Ltd is used to support the filter. A high-accuracy goniometer is used to measure the rotary angle of the filter and the accuracy can reach 1″. A computer-controlled stepper motor is used with encoders to ensure wavelength accuracy.
The center wavelength of the interference filter will shift linearly with changes in ambient temperature; there is about 0.016 nm/°C (Andover Corporation filter, varied from company to company) at 529 nm (it is equivalent to a velocity change of ). Andover Corporation temperature controllers with a regulation accuracy of are equipped to maintain the ambient temperature of the bandpass filter. The center wavelength for those three filters is designed at the longest wavelength, and the shorter center wavelength of the filter is realized by tilting the adequate incidence angle.
Macrolens are positioned in the front of the PMT detectors to increase the light collection efficiency and are used to make the input light match the image size of the PMT. The metal-encapsulated PMT (Hamamatsu, PM-HV-R9880-20) is chosen as it has a constant spectral sensitivity, high photon and quantum efficiency, and low dark noise over the broad range of the measured wavelength (). The PMT is capable of an approximately nanosecond temporal response and a wide dynamic range to 5 orders of magnitude.
A schematic view of the measurement principle for filter spectroscopy is shown in Fig. 3. The new method for measuring the ion temperature and the rotation using the filter spectrometer is based on the ratios of the signals corresponding to the detection of three portions of the same impurity emission line, using three PMTs (see Fig. 2). The left channel integrates the left part (area in Fig. 3) of the spectral line profile; the central and the right channels integrate its center and the right part (areas and , respectively). Therefore, as the change of the plasma temperature and rotation, the areas for three parts will increase or decrease, which reflect the changes of the plasma ion temperature and rotation. The ion temperature and the rotation velocity are calculated from the ratios of the signals collected by the PMTs, as described in the following.
Figure 3.Schematic representation of the measurement principle of filter spectroscopy. Three Gaussian functions with different central wavelength and width are used to represent the spectral sensitivity and a slight difference for each channel is assumed.
The signal intensity () detected by each PMT is expressed as where is the spectral sensitivity of each channel including the filter, Macrolens, PMT, and so on, which can be measured by the relative calibration; and is the intensity distribution of the measured spectrum, which is usually described by a single Gaussian profile in the tokamak plasma[14].
Then the ratio between the intensities of two side-channels and the central channel can be written as where , , and represent the left, right, and center channels, respectively; and are the wavelength differences between the central wavelength of the filter and the fiducial line, respectively; and are the bandwidth of the filters used. It is demonstrated according to Eq. (4) that the intensity ratios are only sensitive to the rotation velocity and ion temperature .
A typical 2D data set calculated with Eq. (4) which shows the temperature and density dependence of and is depicted in Fig. 4. To achieve reliable measurement with the Carbon VI line in the range of and , the calculated parameters of the filter is as follows: the center wavelength for the three filters is designed at 529.55 nm and the bandwidth is 1 nm full-width half-maximum (FWHM). The differences between the center wavelength of the three filters and the designed wavelength are , , and 0 nm, respectively. The tilt angle of the silica filter calculated with Eq. (2) for the two short wavelengths is about 3.6° and 5.1°, respectively. A look-up table for the relation between the intensity ratio and the ion temperature and the rotation velocity is constructed and the experiment values of and are given by the interpolation of the measured intensity ratio.
Figure 4.Ion temperature and rotation velocity dependence of the line intensity ratios and as calculated with Eq. (4).
In conclusion, a filter spectrometer prototype for fast measurements of the plasma ion temperature and rotation on the EAST tokamak is being designed. The Doppler broadening and Doppler shift of the plasma spectral line is determined by the signal intensity ratio of the three-filter channels that have different peak wavelengths. A rapid calculated algorithm of the temperature and rotation velocity is presented. This filter spectrometer with the suitable filter parameters will allow researchers to measure spectra with the temperature and velocity range of 0.1–5 keV and to 250 km/s, respectively.
Yingying Li, Xianghui Yin, Bangxin Wang, Yi Zhang, Jia Fu, Bo Lv. Design of filter spectroscopy for the measurement of plasma ion temperature and rotation on the Experimental Advanced Superconducting Tokamak tokamak[J]. Chinese Optics Letters, 2015, 13(Suppl.): S21202