
Shuheng Chi, Liang Li, Yiqun Wu. Preparation of two-photon fluorescent probe and biological imaging application in cells[J]. Chinese Optics Letters, 2016, 14(6): 061603
- Chinese Optics Letters
- Vol. 14, Issue 6, 061603 (2016)
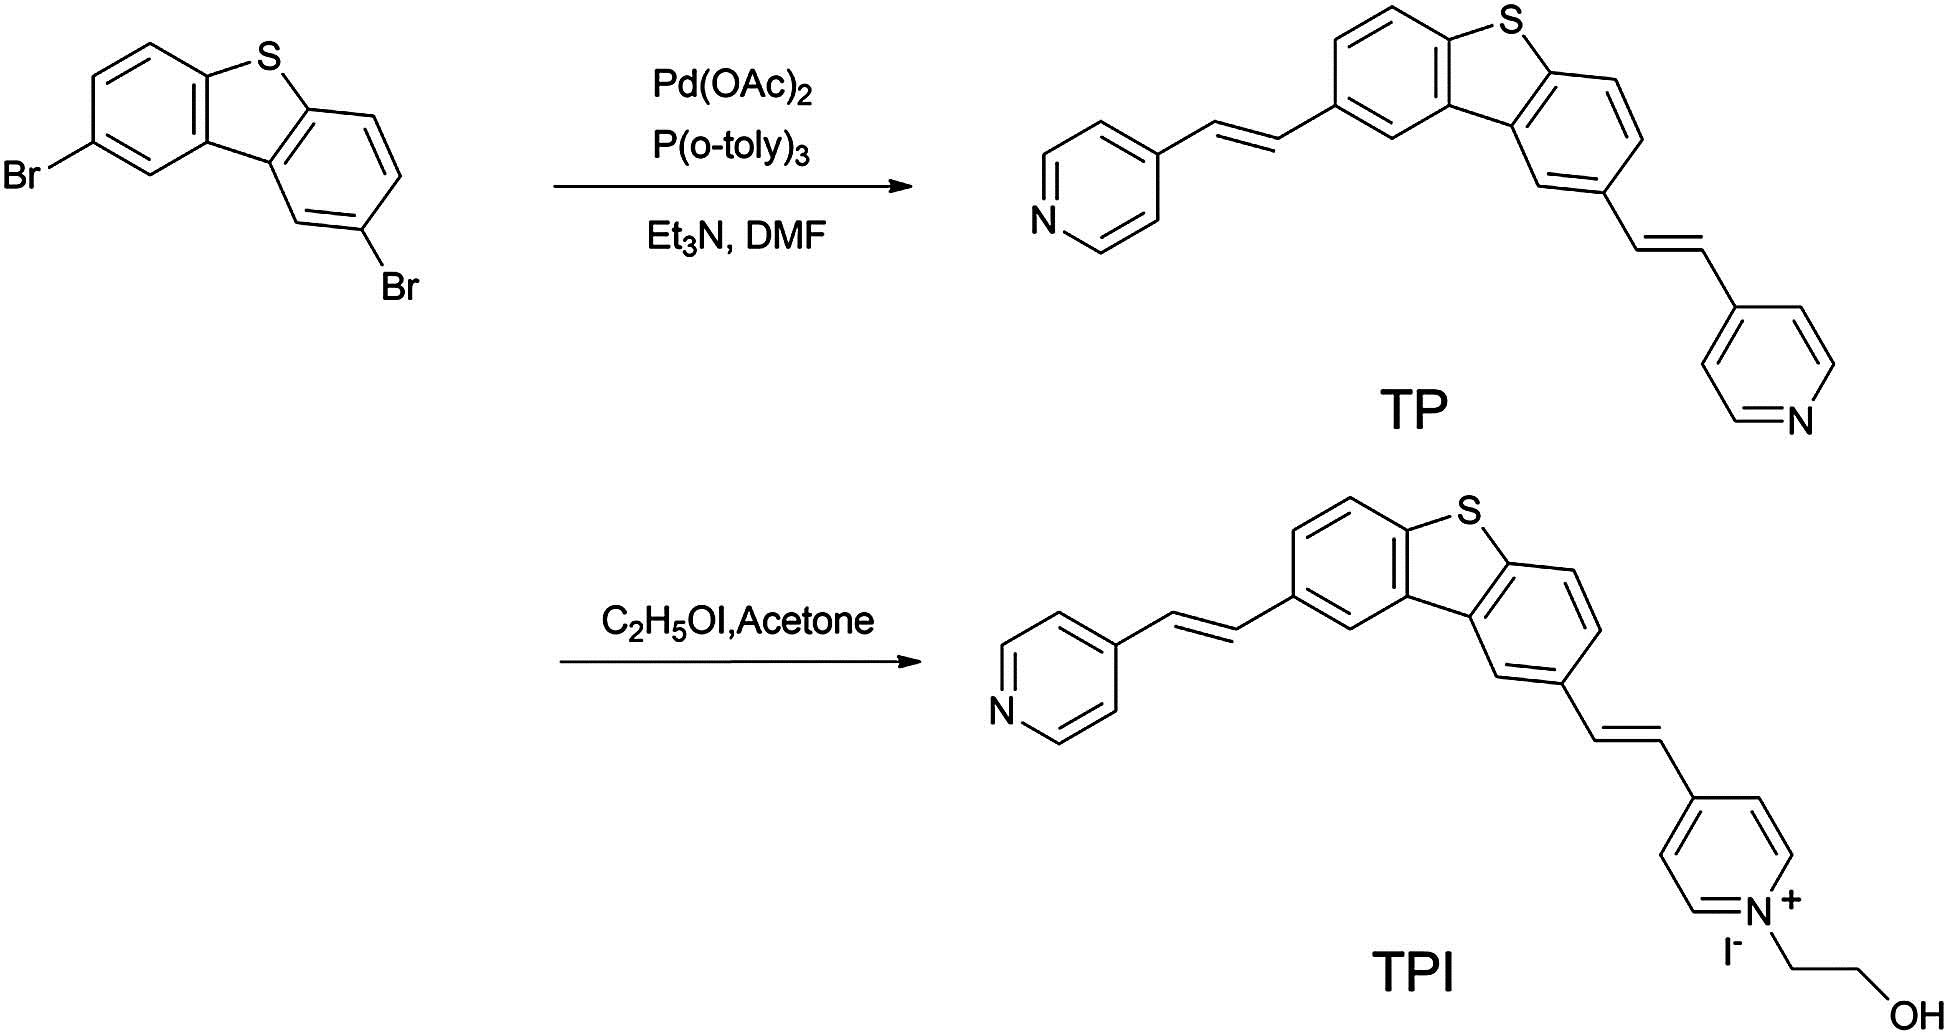
Fig. 1. Synthesis of dibenzothiophene-based fluorescent probe.
![Normalized UV absorption and one-photon fluorescence (FL) spectra of TP and TPI in DMF, [TPI]=10−5 mol/L.](/richHtml/col/2016/14/6/061603/img_002.jpg)
Fig. 2. Normalized UV absorption and one-photon fluorescence (FL) spectra of TP and TPI in DMF, [ TPI ] = 10 − 5 mol / L
Fig. 3. Two-photon fluorescence spectra of TPI and DAPI in DMF, [ TPI ] = [ DAPI ] = 10 − 4 m o l / L
Fig. 4. (a) and (c) UV absorption and OPEF responses of DAPI and (b) and (d) TPI upon the titration of DNA in the Tris-HCl buffer solutions, [ TPI ] = [ DAPI ] = 10 − 5 m o l / L [ DNA ] = 0 − 1.3 × 10 − 3 m o l / L
Fig. 5. One-photon and two-photon confocal fluorescence images of 3T3 cells stained with TPI (0.5 μmol/L) for 3 h. (a) TPEF bioimaging; (b) DIC picture; (c) OPEF bioimaging; (d) Merged bioimaging of a and c. The wavelength for two-photon and one-photon excitation was 800 and 405 nm, respectively. Scale bar was 50 μm.
Fig. 6. Confocal fluorescence images of 3T3 cells co-stained with TPI (0.5 μmol/L) and MTR (0.5 μmol/L). For TPI, λ ex = 405 nm λ em = 525 − 575 nm λ ex = 575 nm λ em = 585 − 660 nm
Fig. 7. Time-dependent confocal fluorescence bioimaging of 3T3 cells stained with TPI (0.5 μmol/L) for 15 min. The excitation wavelength was 800 nm. Scale bar was 50 μm.
Fig. 8. Time-dependent confocal fluorescence bioimaging of 3T3 cells stained with DAPI (0.5 μmol/L) for 15 min. The excitation wavelength was 740 nm. Scale bar was 20 μm.
Fig. 9. Comparison of photostability of TPI and DAPI under successive irradiation.

Set citation alerts for the article
Please enter your email address
© Copyright 2018-2021 | Chinese Laser Press. All Rights Reserved 沪ICP备15018463号-20