
Simon Amann, Tobias Haist, Alexander Gatto, Markus Kamm, Alois Herkommer. Design and realization of a miniaturized high resolution computed tomography imaging spectrometer[J]. Journal of the European Optical Society-Rapid Publications, 2023, 19(2): 2023027
Journals >Journal of the European Optical Society-Rapid Publications >Volume 19 >Issue 2 >Page 2023027 > Article
- Journal of the European Optical Society-Rapid Publications
- Vol. 19, Issue 2, 2023027 (2023)
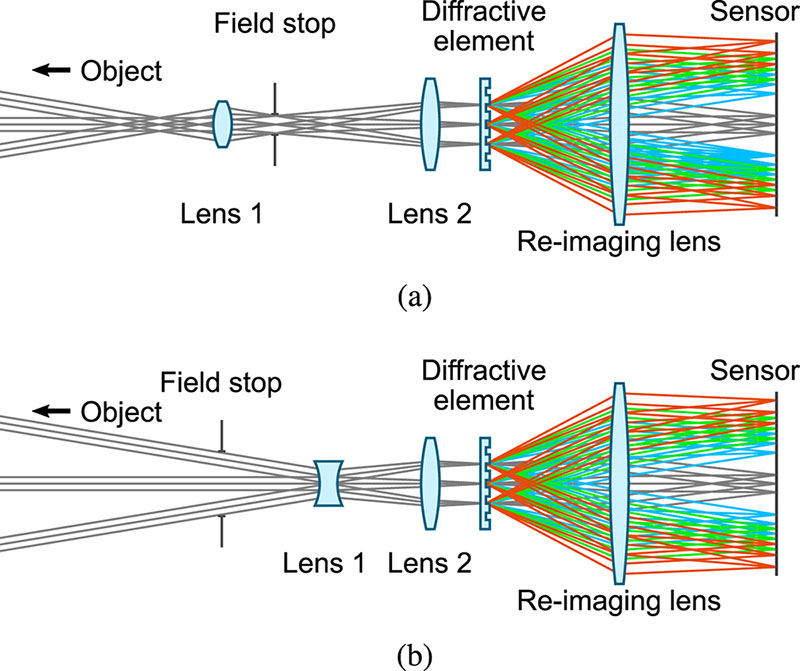
Fig. 1. Different CTIS designs using (a) a Keplerian and (b) a Galilean beam expander.
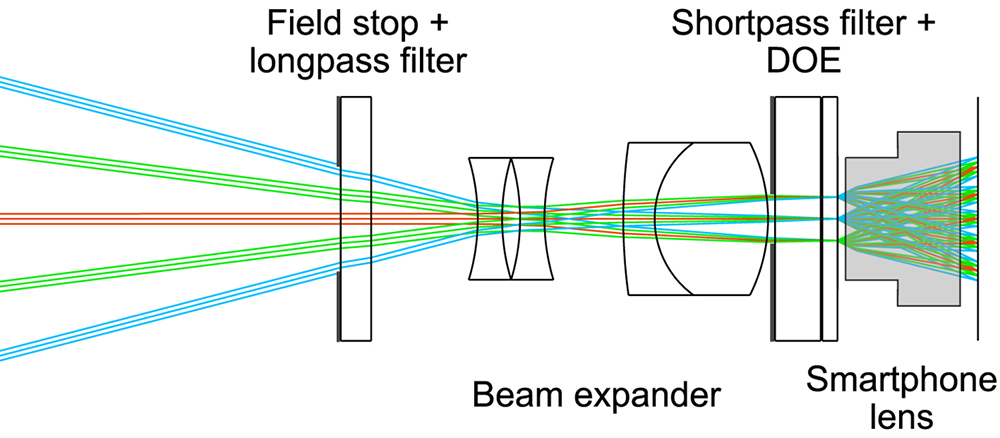
Fig. 2. Optical design of the prototype.
Fig. 3. Part of the CGH design file (a) and a photo of the finished glass waver (b).
Fig. 4. Photo of all individual components (a) and the assembled prototype (b). (a) All components of the miniaturized prototype. A: field stop, B: long pass filter, C: lens 1, D: lens 2, E: short pass filter, F: aperture, G: CGH, H: lens 3, I: image sensor. (b) Photo of the assembled prototype.
Fig. 5. Raw sensor signals (a) and (b), stray light subtracted from the high exposure time image (c) shown in false color, and the pre-processed image (d). The low exposure time image is taken with an exposure time of 62.5 ms, the high exposure time image with an exposure time of (1 s). The subtracted stray light makes up to 20% of the signal of the higher order projections. (a) Low exposure time. (b) High exposure time. (c) Subtracted stray light. (d) Pre-processed image.
Fig. 6. RGB image calculated from the digitally overexposed PSF data cube. The spot of one projection is depicted for a wavelength of 670 nm. It is shown before and after fitting.
Fig. 7. Reconstruction results of the measurement taken of the ColorChecker. The RGB image is computed according to the CIE 1931 color space. It has a yellow tint because no blue light is measured. The shown spectra are averaged over a 5 × 5 pixel area indicated by A and B. The ground truth is shown in dashed black lines.

Set citation alerts for the article
Please enter your email address
© Copyright 2018-2021 | Chinese Laser Press. All Rights Reserved 沪ICP备15018463号-20