
N. Xu, M. J. V. Streeter, O. C. Ettlinger, H. Ahmed, S. Astbury, M. Borghesi, N. Bourgeois, C. B. Curry, S. J. D. Dann, N. P. Dover, T. Dzelzainis, V. Istokskaia, M. Gauthier, L. Giuffrida, G. D. Glenn, S. H. Glenzer, R. J. Gray, J. S. Green, G. S. Hicks, C. Hyland, M. King, B. Loughran, D. Margarone, O. McCusker, P. McKenna, C. Parisuaña, P. Parsons, C. Spindloe, D. R. Symes, F. Treffert, C. A. J. Palmer, Z. Najmudin. Versatile tape-drive target for high-repetition-rate laser-driven proton acceleration[J]. High Power Laser Science and Engineering, 2023, 11(2): 02000e23
- High Power Laser Science and Engineering
- Vol. 11, Issue 2, 02000e23 (2023)
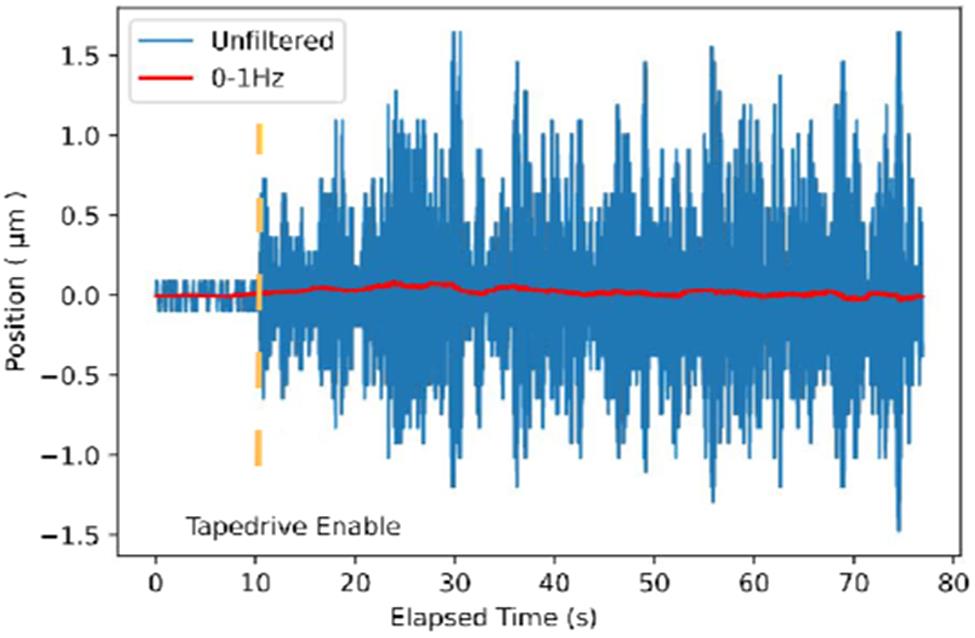
Fig. 1. Position measurements of target tape using the CHRocodile illustrating the vibrations associated with startup of the tape drive (vertical yellow (dotted) line indicates the start time). The instrument background and intrinsic breadboard vibration can be observed before the start of the tape drive, that is, for ‘elapsed time’ of less than 10 seconds. Following startup, the position of the tape surface as it spools past the detector is provided for just over 1 minute. For the whole measurement time-period the instantaneous surface position measured with a temporal sampling width of 15 microseconds is provided in blue, together with the low-pass filtered signal with a cut-off of 1 Hz to demonstrate long-term drift behaviour.
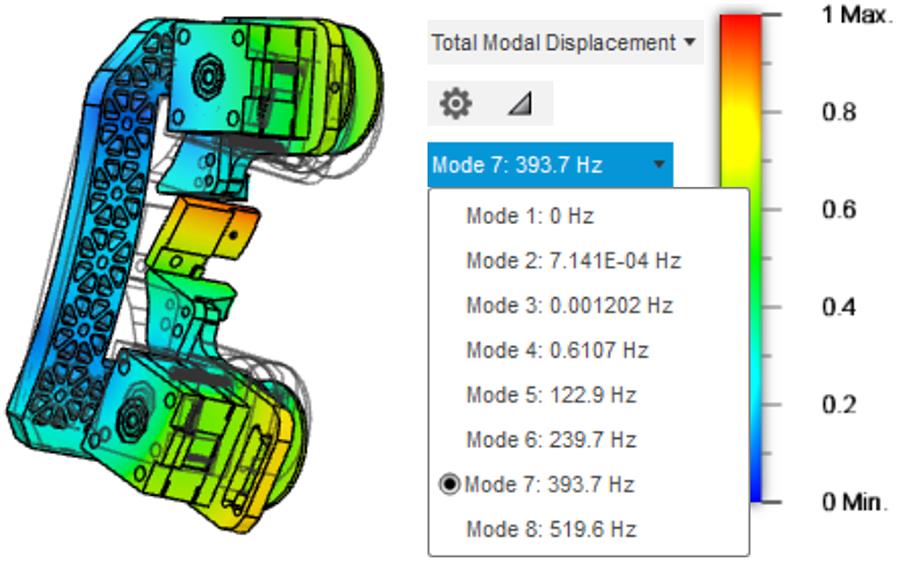
Fig. 2. Finite-element modal response analysis of the tape drive illustrating the positional displacement of the tape-drive components fixed to a rigid breadboard associated with resonant oscillations of the tape drive at 393.7 Hz. The resonant frequency modes of the structure are listed.
Fig. 3. (left) Side-on photograph of the tape drive showing the upper and lower spools as well as the brass frame, which acts to support the tape at the interaction point for increased stability. (centre) Face-on photograph of the tape drive zoomed in on the interaction point. This shows the transparent Kapton tape running vertically on the brass supports. The interaction point is at the centre of the hole in the brass support with the long groove to the left cut-away to provide improved diagnostic access from a shallow viewing angle for the on-shot target monitor. (right) Photograph of the tape after it has been shot with 400 mJ on-target laser energy, which produces less than 1 mm diameter holes. The black markers along the left of the tape are spaced by 1 mm, indicating an approximate spacing of 2 mm between hole centres achieved at a low linear operating speed of 2 mm/s in order to conserve the target material. The tape drive is fully characterized from 2 to 256 mm/s, although the hardware is capable of significantly higher speeds ( 500 mm/s).
500 mm/s). Fig. 4. Optical surface profiling of the 12.7 μm Kapton tape using a combination of high-magnification bright-field microscopy (left) and white light interferometry (right), showing commonly found ‘bubble’ defects visible as dark-spots in the left-hand image. Note that the lack of global flatness in the right-hand image is an artifact of the measuring state (without tension).
Fig. 5. Tape material positional jitter measured using the Precitec CHRocodile for over 1 minute for different materials at 2 mm/s tape speed. In all cases except the top-left, the measurement was made at the position of the high-intensity laser interaction. For the top-left plot, the stability of the brass support plate itself was measured. The dashed vertical line represents the switch-on time of the drive. The blue (highly modulated) line provides the measurement with a temporal sampling period of 15 microseconds with high-frequency changes attributed to tape surface roughness. The low ( Hz) frequency movement, which better represents the tape motion, is shown with the red (solid) line.
Hz) frequency movement, which better represents the tape motion, is shown with the red (solid) line. Fig. 6. Tape positional jitter across a wide range of speeds measured using the Precitec CHRocodile over 1 minute operation. The low ( Hz) frequency movement, which better represents the tape motion, is shown with the red line and the RMS variation in position of the raw data is quoted in each subplot. In (c), the oscillations correspond to a resonance of the tape-drive structure. Faster speeds (
 8 mm/s) typically result in lower jitter amplitude, due to less stepper motor vibration due to low-speed motor resonances[32]. The quoted linear tape speed is the minimal speed for a given motor setting corresponding to the minimum diameter of the tape spool (16 mm). Over the full capacity, the linear speed will increase by a factor of three due to the increasing radius of the spool of tape.
Hz) frequency movement, which better represents the tape motion, is shown with the red line and the RMS variation in position of the raw data is quoted in each subplot. In (c), the oscillations correspond to a resonance of the tape-drive structure. Faster speeds (8 mm/s) typically result in lower jitter amplitude, due to less stepper motor vibration due to low-speed motor resonances[32]. The quoted linear tape speed is the minimal speed for a given motor setting corresponding to the minimum diameter of the tape spool (16 mm). Over the full capacity, the linear speed will increase by a factor of three due to the increasing radius of the spool of tape. Fig. 7. Long-term stability measurement of tape guide surface using the Precitec CHRocodile at a tape speed of 125 mm/s, indicating the effect of thermal drift. The blue (highly modulated) line provides the measurement with a temporal sampling period of 0.2 s, including room vibrations. The low ( MHz) frequency movement, which better represents the tape-drive support thermal drift, is shown with the red (solid) line. These fluctuations are due to known temperature oscillations of the laboratory due to the air conditioning control loop.
MHz) frequency movement, which better represents the tape-drive support thermal drift, is shown with the red (solid) line. These fluctuations are due to known temperature oscillations of the laboratory due to the air conditioning control loop. Fig. 8. Experimental schematic showing the target and diagnostic arrangement. The laser was incident at 30° relative to the target normal, with the electron spectrometer positioned to sample electrons accelerated in the laser forward direction. The proton scintillator was centred on the rear target-normal with a central hole for the time-of-flight (TOF) diode to sample the spectrum. The tape drive could be translated along the target normal, with an off-axis self-emission diagnostic used to measure the on-shot target plane position.
Fig. 9. Waterfall plot of the normalized forward propagating hot electron spectrum from 50 μm Kapton tape, integrated over the electron spectrometer acceptance angle of 35 μSr, as the tape-drive position was scanned through the laser focus. Negative values of  correspond to arrival of the laser pulse at the tape surface before the laser has reached best focus. Each vertical strip corresponds to the single-shot electron spectrum at the recorded
  position, which was incremented in steps of
  μm between bursts of 10 shots. Vertical (red) lines mark the boundaries of the bursts and the shots within the burst marked
  correspond to the shots presented in
 Figure 10 .
correspond to arrival of the laser pulse at the tape surface before the laser has reached best focus. Each vertical strip corresponds to the single-shot electron spectrum at the recorded position, which was incremented in steps of μm between bursts of 10 shots. Vertical (red) lines mark the boundaries of the bursts and the shots within the burst marked correspond to the shots presented in Fig. 10. (a) Proton spatial profile summed over 10 shots, on 50 μm thick Kapton tape, for which  . This was measured using an EJ-440 scintillator positioned at 16 cm from the interaction centred along the rear surface target normal and filtered with 6 μm aluminized Mylar. The darker stripes are regions of the scintillator with extra filtering of 10, 20 and 30 μm aluminium and an obloid horizontal hole providing access to diagnostics behind the scintillator. The axis of the time-of-flight spectrometer is indicated by the white star. (b) The proton spectra from each individual shot (grey), their average (red solid line) and RMS (red shading), measured using a diamond-diode at 36 cm from the interaction point and at 3° from the rear surface target normal. The laser intensity at a fixed plane has been calculated to fluctuate by 5% (relative median average difference) across these shots based on measurements of the laser energy and wavefront. Despite this relatively high stability, the strongly non-linear nature of the high-intensity laser–plasma interaction leads to significant fluctuations in the proton beam flux.
. This was measured using an EJ-440 scintillator positioned at 16 cm from the interaction centred along the rear surface target normal and filtered with 6 μm aluminized Mylar. The darker stripes are regions of the scintillator with extra filtering of 10, 20 and 30 μm aluminium and an obloid horizontal hole providing access to diagnostics behind the scintillator. The axis of the time-of-flight spectrometer is indicated by the white star. (b) The proton spectra from each individual shot (grey), their average (red solid line) and RMS (red shading), measured using a diamond-diode at 36 cm from the interaction point and at 3° from the rear surface target normal. The laser intensity at a fixed plane has been calculated to fluctuate by 5% (relative median average difference) across these shots based on measurements of the laser energy and wavefront. Despite this relatively high stability, the strongly non-linear nature of the high-intensity laser–plasma interaction leads to significant fluctuations in the proton beam flux.
|
Table 1. Measured surface positional jitter with different tape materials: 50 μm Kapton tape with the best surface roughness shows 0.28 μm RMS tape-drive performance. The lack of better (ideally  10 nm Ra roughness) surface quality sample limited true tape-drive performance characterization.
10 nm Ra roughness) surface quality sample limited true tape-drive performance characterization. 
Set citation alerts for the article
Please enter your email address
© Copyright 2018-2021 | Chinese Laser Press. All Rights Reserved 沪ICP备15018463号-20