• Acta Photonica Sinica
  • Vol. 48, Issue 12, 1212002 (2019)
Yu-jing QIAO1、1、2、2, Si-yuan ZHANG2、2, and Yu-hang ZHAO2、2
Author Affiliations
  • 1Key Laboratory of Advanced Manufacturing and Intelligent Technology, Ministry of Education, Harbin 150080, China
  • 2Institute of Mechanical & Power Engineering, Harbin University of Science and Technology, Harbin 150080, China
  • show less
    DOI: 10.3788/gzxb20194812.1212002 Cite this Article
    Yu-jing QIAO, Si-yuan ZHANG, Yu-hang ZHAO. Surface Robust Reconstruction Method for High Lightand Weak Textured Objects[J]. Acta Photonica Sinica, 2019, 48(12): 1212002 Copy Citation Text show less
    朗伯光学反射模型Lambertian optical reflection model
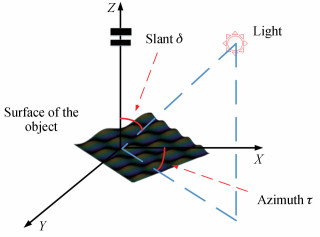
    Fig. 1. 朗伯光学反射模型Lambertian optical reflection model
    瓷水杯在均光处理前后的图片对照, 取样过程和像素变化Picture comparison, sampling process and pixel change of porcelain cup before and after homogenizing treatment
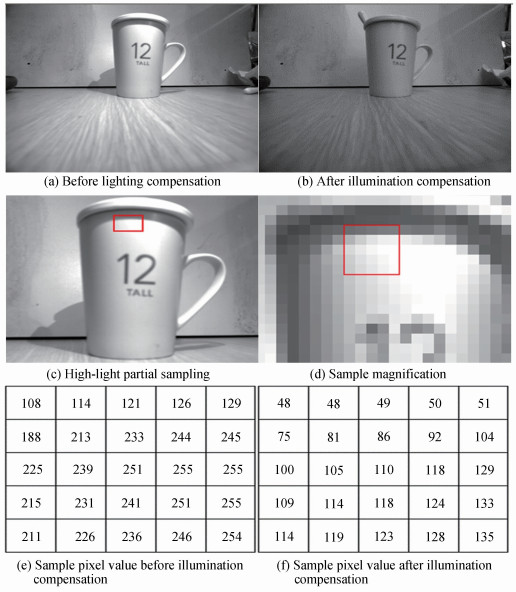
    Fig. 2. 瓷水杯在均光处理前后的图片对照, 取样过程和像素变化Picture comparison, sampling process and pixel change of porcelain cup before and after homogenizing treatment
    传统均值漂移算法示意图Schematic diagram of traditional mean shift algorithm
    Fig. 3. 传统均值漂移算法示意图Schematic diagram of traditional mean shift algorithm
    传统均值漂移算法缺陷Traditional mean shiftalgorithm defect
    Fig. 4. 传统均值漂移算法缺陷Traditional mean shiftalgorithm defect
    激光点投射变化情况Laser spot projection changes
    Fig. 5. 激光点投射变化情况Laser spot projection changes
    激光点群对均值漂移的算法影响Influence of laser point group on mean shift algorithm
    Fig. 6. 激光点群对均值漂移的算法影响Influence of laser point group on mean shift algorithm
    漂移描述子功能示意图Drift description subfunction diagram
    Fig. 7. 漂移描述子功能示意图Drift description subfunction diagram
    深度图平滑处理前后比较示意图Schematic diagram of before and after comparison of depth map smoothing
    Fig. 8. 深度图平滑处理前后比较示意图Schematic diagram of before and after comparison of depth map smoothing
    Tsukuba图片的原图、深度图、重建图比较Comparison of original images, disparity maps and reconstruction maps of Tsukuba images
    Fig. 9. Tsukuba图片的原图、深度图、重建图比较Comparison of original images, disparity maps and reconstruction maps of Tsukuba images
    实拍图片重建效果Real shot image reconstruction effect
    Fig. 10. 实拍图片重建效果Real shot image reconstruction effect
    显示器背面的尺寸取样示意图Sampling of dimensions on the back of the monitor
    Fig. 11. 显示器背面的尺寸取样示意图Sampling of dimensions on the back of the monitor
    显示器重建前后的样本尺寸值Sample size values before and after monitor reconstruction
    Fig. 12. 显示器重建前后的样本尺寸值Sample size values before and after monitor reconstruction
    各方法RMSE性能评价RMSE performance evaluation of each method
    Fig. 13. 各方法RMSE性能评价RMSE performance evaluation of each method
    各方法PSNR和SSIM性能评价PSNR and SSIM performance evaluation of each method
    Fig. 14. 各方法PSNR和SSIM性能评价PSNR and SSIM performance evaluation of each method
    DirectionTop leftTop rightLeftCentralRightBottomBottom right
    τ118.6090.53106.096.2629.22110.0167.04
    δ89.3886.5286.5275.3785.3775.0696.83
    Table 1. Optical parameter azimuth and inclination estimation (Unit: degree)
    The name of algorithmImage size/pixelTime consuming/ms
    GC algorithm384×2882 272
    Ref. [10] algorithm384×2881 702
    Algorithm of this paper384×2881 878
    Table 2. Time-consuming reference for standard test image reconstruction experiment algorithm under different methods
    Yu-jing QIAO, Si-yuan ZHANG, Yu-hang ZHAO. Surface Robust Reconstruction Method for High Lightand Weak Textured Objects[J]. Acta Photonica Sinica, 2019, 48(12): 1212002
    Download Citation