• High Power Laser Science and Engineering
  • Vol. 12, Issue 2, 02000e13 (2024)
Yuefang Yan1、2, Yu Liu1, Haoyu Zhang1, Yuwei Li1, Chao Guo1, Qiang Shu1, Wenhui Huang2, Feng Jing1, and Rumao Tao1、*
Author Affiliations
  • 1Laser Fusion Research Center, China Academy of Engineering Physics, Mianyang, China
  • 2Key Laboratory of Particle & Radiation Imaging (Tsinghua University), Ministry of Education, Beijing, China
  • show less
    DOI: 10.1017/hpl.2023.88 Cite this Article Set citation alerts
    Yuefang Yan, Yu Liu, Haoyu Zhang, Yuwei Li, Chao Guo, Qiang Shu, Wenhui Huang, Feng Jing, Rumao Tao. Mismatch analysis of all-fiber coherent beam combiners based on the self-imaging effect[J]. High Power Laser Science and Engineering, 2024, 12(2): 02000e13 Copy Citation Text show less
    Diagram of the all-fiber coherent beam combiner based on the self-imaging effect.
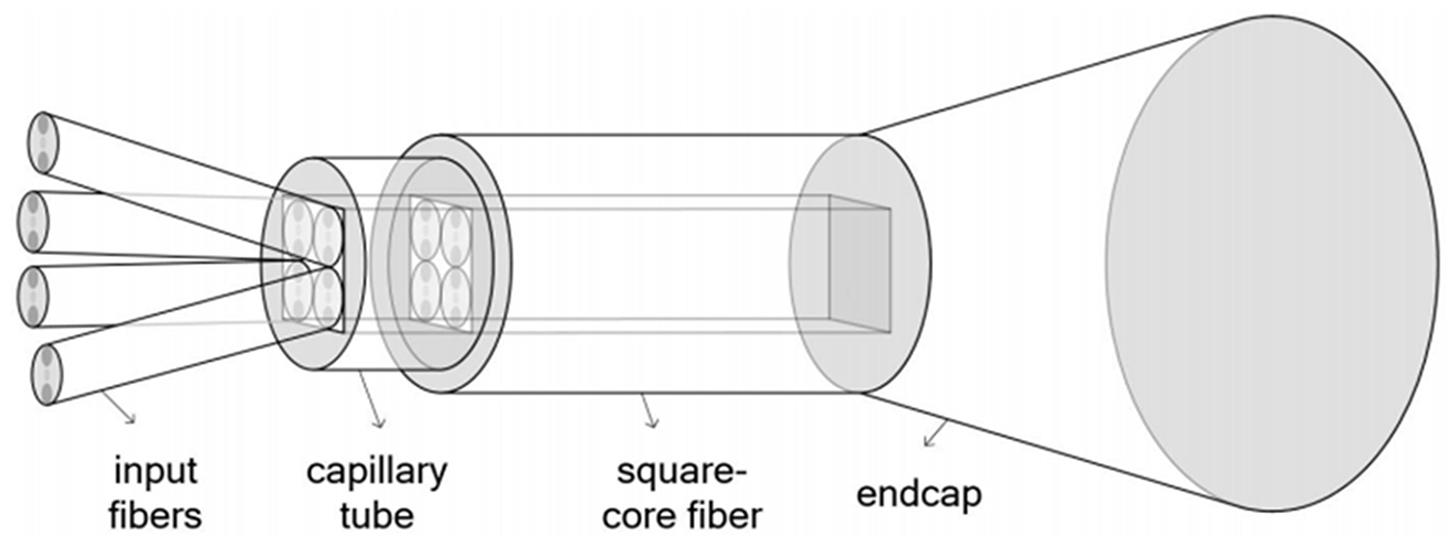
    Fig. 1. Diagram of the all-fiber coherent beam combiner based on the self-imaging effect.
    Diagram of (a) the position error and (b) the polarization deviation of the fiber array.
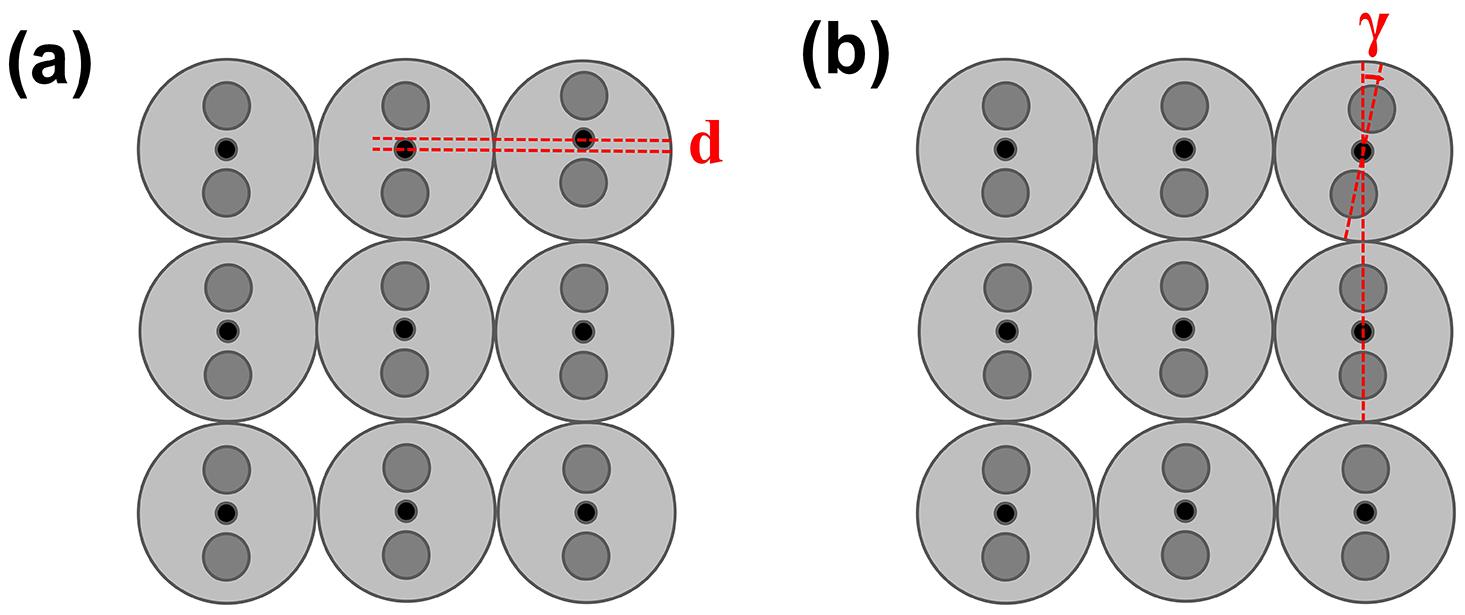
    Fig. 2. Diagram of (a) the position error and (b) the polarization deviation of the fiber array.
    Diagram of (a) the transversal offset, (b) the angular offset and (c) the pointing error between the fiber array and the square-core fiber.
    Fig. 3. Diagram of (a) the transversal offset, (b) the angular offset and (c) the pointing error between the fiber array and the square-core fiber.
    Diagram of (a) the core roundness, (b) the side inclination, (c) the twist and (d) the bending of square-core fiber.
    Fig. 4. Diagram of (a) the core roundness, (b) the side inclination, (c) the twist and (d) the bending of square-core fiber.
    Dependence of (a) the beam quality and (b) the efficiency of CBC on the position error of the fiber array. (c) Intensity distribution of the combined beam influenced by position error. (d) Diagram of the tolerance to position error corresponding to 1% loss of the beam combining efficiency under different fiber arrays.
    Fig. 5. Dependence of (a) the beam quality and (b) the efficiency of CBC on the position error of the fiber array. (c) Intensity distribution of the combined beam influenced by position error. (d) Diagram of the tolerance to position error corresponding to 1% loss of the beam combining efficiency under different fiber arrays.
    Dependence of (a) the beam quality and (b) the efficiency of CBC on the polarization deviation of the fiber array. (c) Intensity distribution of the combined beam influenced by polarization deviation. (d) Diagram of the tolerance to polarization direction error corresponding to 1% loss of beam combining efficiency under different fiber arrays.
    Fig. 6. Dependence of (a) the beam quality and (b) the efficiency of CBC on the polarization deviation of the fiber array. (c) Intensity distribution of the combined beam influenced by polarization deviation. (d) Diagram of the tolerance to polarization direction error corresponding to 1% loss of beam combining efficiency under different fiber arrays.
    Dependence of (a) the beam quality and (b) the efficiency of CBC on the transversal offset between the fiber array and the square-core fiber. (c) Intensity distribution of the combined beam influenced by transversal offset. (d) Diagram of the tolerance to transversal offset corresponding to 1% loss of beam combining efficiency under different fiber arrays.
    Fig. 7. Dependence of (a) the beam quality and (b) the efficiency of CBC on the transversal offset between the fiber array and the square-core fiber. (c) Intensity distribution of the combined beam influenced by transversal offset. (d) Diagram of the tolerance to transversal offset corresponding to 1% loss of beam combining efficiency under different fiber arrays.
    Dependence of (a) the beam quality and (b) the efficiency of CBC on the angular offset between the fiber array and the square-core fiber. (c) Intensity distribution of the combined beam influenced by angular offset. (d) Diagram of the tolerance to angular offset corresponding to 1% loss of beam combining efficiency under different fiber arrays.
    Fig. 8. Dependence of (a) the beam quality and (b) the efficiency of CBC on the angular offset between the fiber array and the square-core fiber. (c) Intensity distribution of the combined beam influenced by angular offset. (d) Diagram of the tolerance to angular offset corresponding to 1% loss of beam combining efficiency under different fiber arrays.
    Dependence of (a) the beam quality and (b) the efficiency of CBC on the pointing error between the fiber array and the square-core fiber. (c) Intensity distribution of the combined beam influenced by the pointing error. (d) Diagram of the tolerance to pointing error corresponding to 1% loss of beam combining efficiency under different fiber arrays.
    Fig. 9. Dependence of (a) the beam quality and (b) the efficiency of CBC on the pointing error between the fiber array and the square-core fiber. (c) Intensity distribution of the combined beam influenced by the pointing error. (d) Diagram of the tolerance to pointing error corresponding to 1% loss of beam combining efficiency under different fiber arrays.
    Dependence of (a) the beam quality and (b) the efficiency of CBC on the corner radius of the square-core fiber. (c) Intensity distribution of the combined beam influenced by rounded corners. (d) Diagram of the tolerance to rounded corners corresponding to 1% loss of beam combining efficiency under different fiber arrays.
    Fig. 10. Dependence of (a) the beam quality and (b) the efficiency of CBC on the corner radius of the square-core fiber. (c) Intensity distribution of the combined beam influenced by rounded corners. (d) Diagram of the tolerance to rounded corners corresponding to 1% loss of beam combining efficiency under different fiber arrays.
    Dependence of (a) the beam quality and (b) the efficiency of CBC on the side straightness of the square-core fiber. (c) Intensity distribution of the combined beam influenced by curved edge borders. (d) Diagram of the tolerance to curved edge borders corresponding to 1% loss of beam combining efficiency under different fiber arrays.
    Fig. 11. Dependence of (a) the beam quality and (b) the efficiency of CBC on the side straightness of the square-core fiber. (c) Intensity distribution of the combined beam influenced by curved edge borders. (d) Diagram of the tolerance to curved edge borders corresponding to 1% loss of beam combining efficiency under different fiber arrays.
    Dependence of (a) the beam quality and (b) the efficiency of CBC on the side inclination of the square-core fiber. (c) Intensity distribution of the combined beam influenced by slanted edge borders. (d) Diagram of the tolerance to slanted edge borders corresponding to 1% loss of beam combining efficiency under different fiber arrays.
    Fig. 12. Dependence of (a) the beam quality and (b) the efficiency of CBC on the side inclination of the square-core fiber. (c) Intensity distribution of the combined beam influenced by slanted edge borders. (d) Diagram of the tolerance to slanted edge borders corresponding to 1% loss of beam combining efficiency under different fiber arrays.
    Dependence of (a) the beam quality and (b) the efficiency of CBC on the twist angle of the square-core fiber. (c) Intensity distribution of the combined beam influenced by the square-core fiber twist. (d) Diagram of the tolerance to square-core fiber twist corresponding to 1% loss of beam combining efficiency under different fiber arrays.
    Fig. 13. Dependence of (a) the beam quality and (b) the efficiency of CBC on the twist angle of the square-core fiber. (c) Intensity distribution of the combined beam influenced by the square-core fiber twist. (d) Diagram of the tolerance to square-core fiber twist corresponding to 1% loss of beam combining efficiency under different fiber arrays.
    Dependence of (a) the beam quality and (b) the efficiency of CBC on the bending radius of the square-core fiber. (c) Intensity distribution of the combined beam influenced by square-core fiber bending. (d) Diagram of the tolerance to square-core fiber bending corresponding to 1% loss of beam combining efficiency under different fiber arrays.
    Fig. 14. Dependence of (a) the beam quality and (b) the efficiency of CBC on the bending radius of the square-core fiber. (c) Intensity distribution of the combined beam influenced by square-core fiber bending. (d) Diagram of the tolerance to square-core fiber bending corresponding to 1% loss of beam combining efficiency under different fiber arrays.
    The combining efficiency of the fundamental mode and the high-order mode varies with different welding position deviations.
    Fig. 15. The combining efficiency of the fundamental mode and the high-order mode varies with different welding position deviations.
    (a) Diagram of the spot array output by the fiber array. (b) Diagram of the combining spot.
    Fig. 16. (a) Diagram of the spot array output by the fiber array. (b) Diagram of the combining spot.
    Microscopic images of the 2 × 2 self-imaging combiner: (a) on the fiber array side; (b) on the square-core fiber side.
    Fig. 17. Microscopic images of the 2 × 2 self-imaging combiner: (a) on the fiber array side; (b) on the square-core fiber side.
    Variation of
    tolerance with
    the increasing
    Error tolerance at 1% combining efficiency losscombination
    Type of mismatch error2 × 23 × 34 × 45 × 56 × 6channels
    Alignment errorPosition error (μm)0.300.280.260.230.20Stricter
    of fiber arrayPolarization deviation (°)5.04.54.33.73.5Stricter
    Assembly errorTransversal offset (μm)0.500.480.470.440.42Stricter
    between fiber arrayAngular offset (°)0.50.340.270.20.15Stricter
    and square-core fiberPointing error (°)0.1000.1030.1050.1080.110Barely changed
    Geometric errorCorner radius (μm)4.04.75.05.55.7More relaxed
    of square-coreSide straightness (μm)0.800.650.500.400.25Stricter
    fiberSide inclination (°)0.600.400.300.200.15Stricter
    Twist angle (°)1.501.000.750.650.50Stricter
    Bending radius (m)4284152256385Stricter
    Table 1. Tolerance for mismatch errors at 1% combining efficiency loss.
    Yuefang Yan, Yu Liu, Haoyu Zhang, Yuwei Li, Chao Guo, Qiang Shu, Wenhui Huang, Feng Jing, Rumao Tao. Mismatch analysis of all-fiber coherent beam combiners based on the self-imaging effect[J]. High Power Laser Science and Engineering, 2024, 12(2): 02000e13
    Download Citation