• Chinese Optics Letters
  • Vol. 16, Issue 3, 031702 (2018)
Mingjun Xu1, Peng Lei2, Jianqin Feng3, Fangfang Liu1, Sihua Yang2、*, and Pengfei Zhang1、**
Author Affiliations
  • 1Key Laboratory of Cardiovascular Remodeling and Function Research, Department of Cardiology, Qilu Hospital of Shandong University, Jinan 250012, China
  • 2MOE Key Laboratory of Laser Life Science and Institute of Laser Life Science, College of Biophotonics, South China Normal University, Guangzhou 510631, China
  • 3Department of Cardiology, The Juye Hospital of Traditional Chinese Medicine, Heze 274900, China
  • show less
    DOI: 10.3788/COL201816.031702 Cite this Article Set citation alerts
    Mingjun Xu, Peng Lei, Jianqin Feng, Fangfang Liu, Sihua Yang, Pengfei Zhang. Photoacoustic characteristics of lipid-rich plaques under ultra-low temperature and formaldehyde treatment[J]. Chinese Optics Letters, 2018, 16(3): 031702 Copy Citation Text show less
    Schematic of the system and photograph of the devices. (a) Schematic of the system: POL, plan objective lens; AMP, amplifier; DAQ, data acquisition system. (b) Schematic of the laser emission and PA signals reception. (c) Photograph of the integrated transducer.
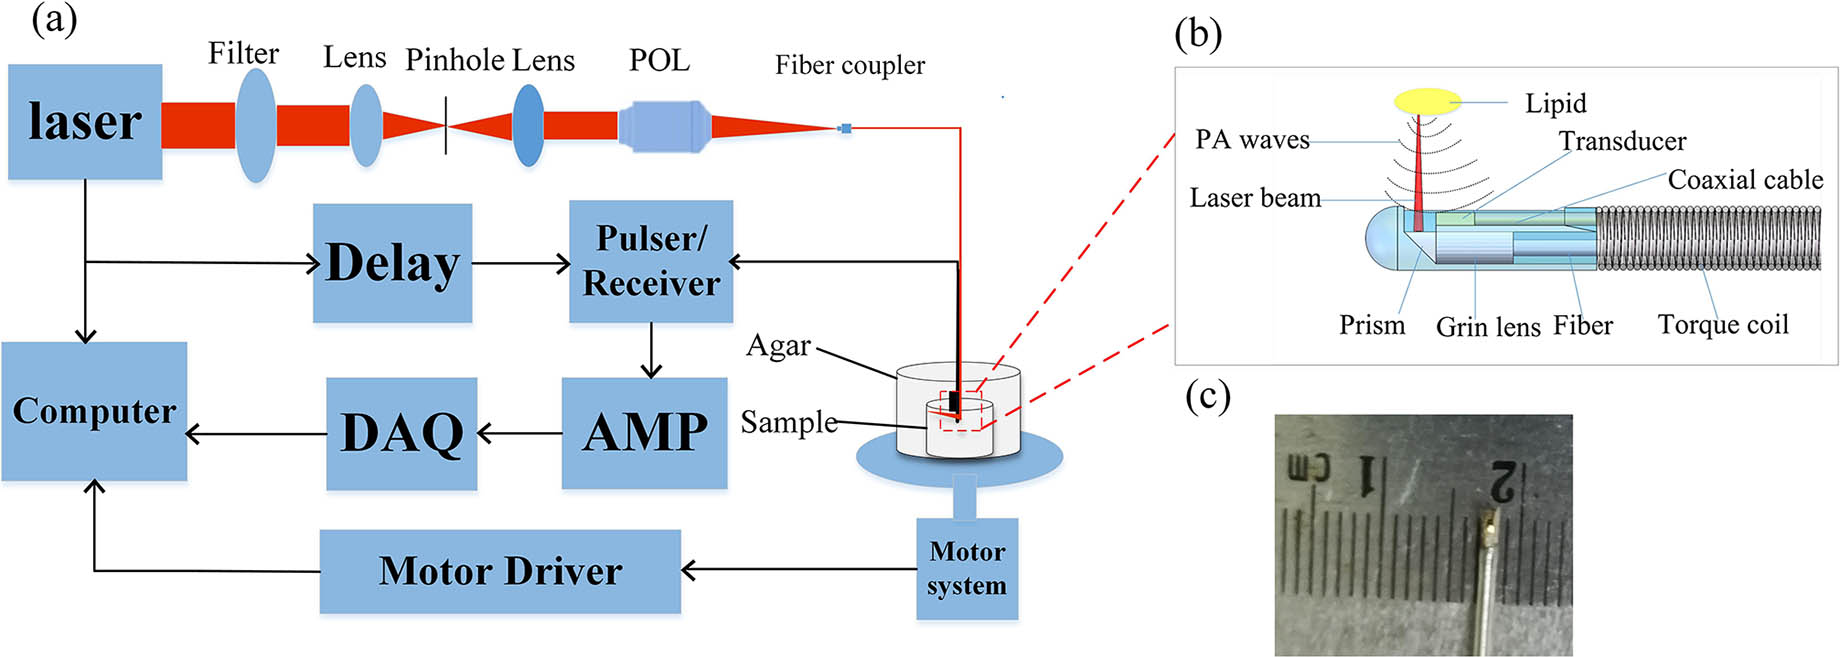
    Fig. 1. Schematic of the system and photograph of the devices. (a) Schematic of the system: POL, plan objective lens; AMP, amplifier; DAQ, data acquisition system. (b) Schematic of the laser emission and PA signals reception. (c) Photograph of the integrated transducer.
    Performance of the transducer and system. (a) The echo signal detected by the transducer. (b) Bandwidth of the transducer elements with a −6 dB bandwidth of 95%. (c) The axial resolution of the system. (d) The lateral resolution of the system.
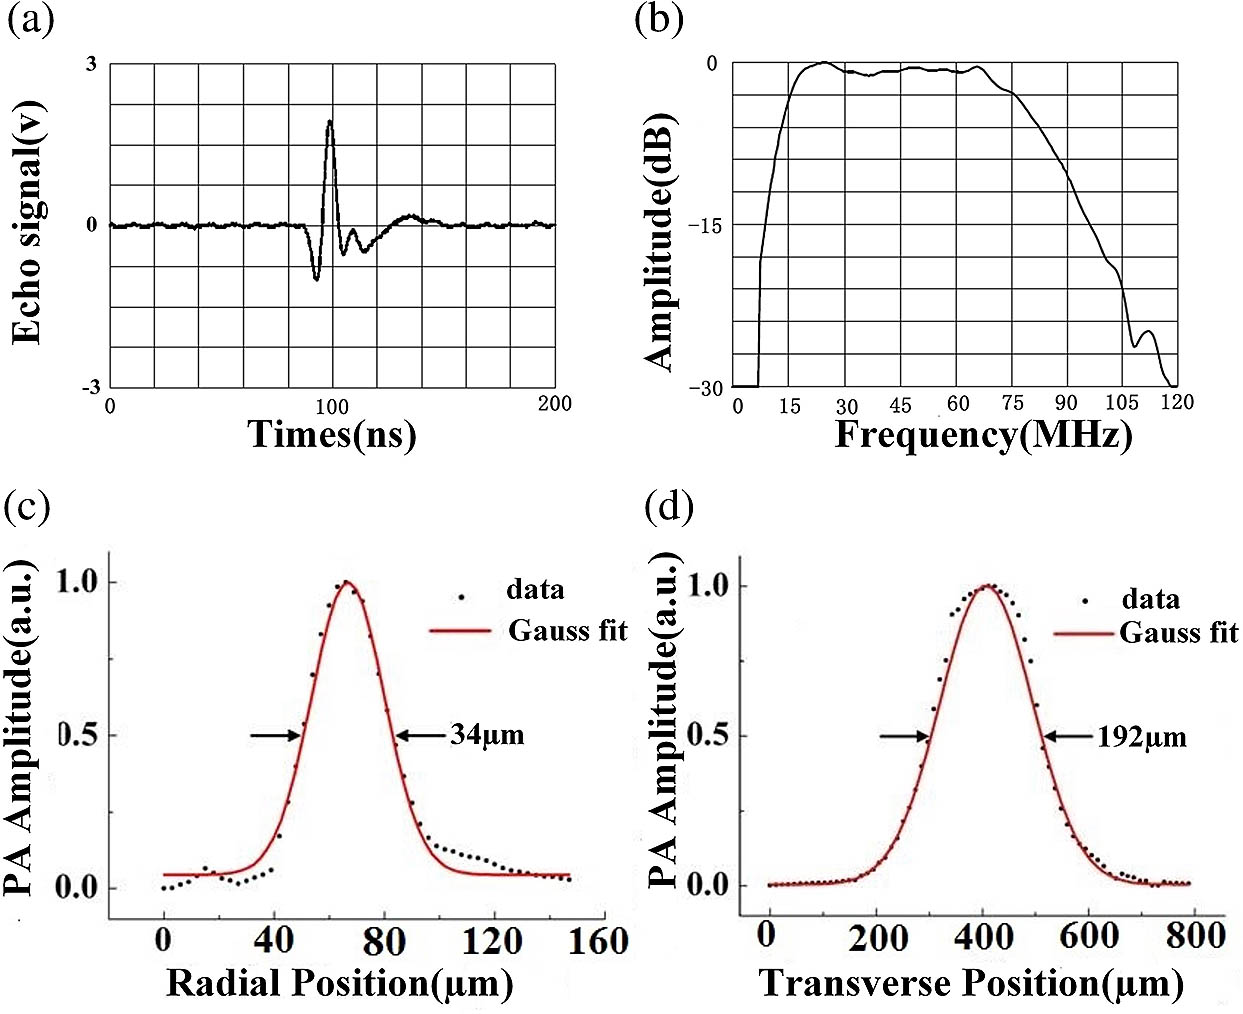
    Fig. 2. Performance of the transducer and system. (a) The echo signal detected by the transducer. (b) Bandwidth of the transducer elements with a 6dB bandwidth of 95%. (c) The axial resolution of the system. (d) The lateral resolution of the system.
    Comparison of PA images experiencing pre- and post-frozen treatment with histological images. (a) The PA cross-section image of No. 2 vessel before frozen treatment. (b) The PA cross-section image of No. 2 vessel as shown in (a) after frozen treatment. (c) The matched histological cross-section image of No. 2 vessel in (a) and (b). LRC, lipid relative concentration.
    Fig. 3. Comparison of PA images experiencing pre- and post-frozen treatment with histological images. (a) The PA cross-section image of No. 2 vessel before frozen treatment. (b) The PA cross-section image of No. 2 vessel as shown in (a) after frozen treatment. (c) The matched histological cross-section image of No. 2 vessel in (a) and (b). LRC, lipid relative concentration.
    Comparison of PA images experiencing pre- and post-formaldehyde treatment with histological images. (a) The PA cross-section image of No. 5 vessel before formaldehyde treatment. (b) The PA cross-section image of No. 5 vessel as shown in (a) after formaldehyde treatment. (c) The matched histological cross-section image of No. 5 vessel in (a) and (b).
    Fig. 4. Comparison of PA images experiencing pre- and post-formaldehyde treatment with histological images. (a) The PA cross-section image of No. 5 vessel before formaldehyde treatment. (b) The PA cross-section image of No. 5 vessel as shown in (a) after formaldehyde treatment. (c) The matched histological cross-section image of No. 5 vessel in (a) and (b).
    Statistical analysis results. (a) Correlation between LR by histology and PAI post-frozen treatment, R2=0.942. (b) Correlation between LR by histology and PAI post-formaldehyde treatment, R2=0.551.
    Fig. 5. Statistical analysis results. (a) Correlation between LR by histology and PAI post-frozen treatment, R2=0.942. (b) Correlation between LR by histology and PAI post-formaldehyde treatment, R2=0.551.
     DifferenceCorrelation
     Before TreatmentAfter TreatmentP ValuePearson CoefficientP Value
    Frozen (N=13)0.334±0.1300.329±0.1220.2990.9900
    Formaldehyde (N=19)0.317±0.0450.316±0.0400.8540.8630
    Table 1. Difference and Correlation of Lipid Ratio Derived by PAI Pre- and Post-Treatments
     PA PercentageHistological PercentageCorrelation
    Before processing0.300±0.0970.332±0.0860.967
    After processing0.371±0.1050.403±0.0970.853
    Table 2. Correlation of Lipid Ratio Derived by PAI and Histology Pre- and Post-Treatments
     PAIHistologyP ValueCorrelation
    Frozen (N=11)0.312±0.1250.370±0.1190.0010.991
    Formaldehyde (N=25)0.397±0.0850.433±0.0710.0110.658
    Table 3. Difference and Correlation of Lipid Ratio Derived by PAI and Histology Post-Frozen and Formaldehyde Treatment
    Mingjun Xu, Peng Lei, Jianqin Feng, Fangfang Liu, Sihua Yang, Pengfei Zhang. Photoacoustic characteristics of lipid-rich plaques under ultra-low temperature and formaldehyde treatment[J]. Chinese Optics Letters, 2018, 16(3): 031702
    Download Citation