
Jianfeng Geng, Lin Wu, Pengfei Guo, Huijun Wang, Xin Lin, Yufeng Zhang, Guang Yang, Weidong Huang. Study on High‐Frequency Narrow Pulse Electrochemical Post‐Processing Behavior of Inconel 718 Alloy by Laser Directed Energy Deposition[J]. Chinese Journal of Lasers, 2024, 51(10): 1002318
- Chinese Journal of Lasers
- Vol. 51, Issue 10, 1002318 (2024)
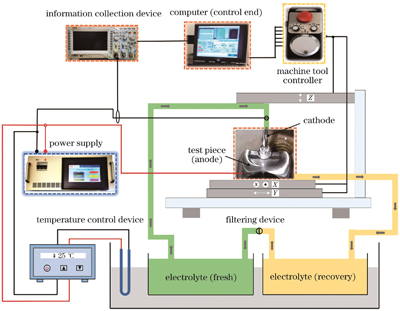
Fig. 1. Schematic of electrolyte jet machining
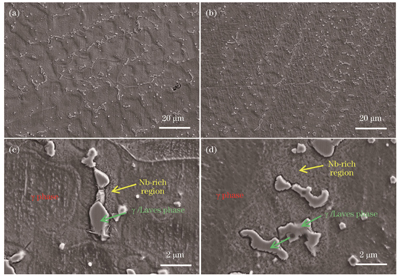
Fig. 2. Microstructure characteristics of Inconel 718 alloy at different cross sections by laser directed energy deposition. Dendrite morphologies at (a) horizontal and (b) vertical sections; phase compositions and distributions at (c) horizontal and (d) vertical sections
Fig. 3. Element distributions of Inconel 718 alloy by laser directed energy deposition
Fig. 4. Surface microstructures of as-deposited Inconel 718 alloy after EJM at different pulse frequencies. (a) 30 kHz; (b) 40 kHz; (c) 60 kHz; (d) 80 kHz; (e) 100 kHz
Fig. 5. Surface roughness and cross-section morphologies of groove prepared by EJM under different pulse frequencies. (a) Surface roughness; (b) cross-section morphologies
Fig. 6. Surface microstructures of as-deposited Inconel 718 alloy after EJM under different duty ratios. (a) 30%; (b) 40%; (c) 50%; (d) 60%; (e) 70%; (f) 80%
Fig. 7. Surface roughness and cross-section morphologies of groove prepared by EJM under different pulse duty ratios. (a) Surface roughness; (b) cross-section morphologies
Fig. 8. Surface microstructures of as-deposited Inconel 718 alloy under different current modes and current densities. (a)(b) 1.05 A/cm2;(c)(d) 5.26 A/cm2; (e)(f) 10.50 A/cm2
Fig. 9. Surface roughness and cross-section morphologies of groove prepared by EJM under different current modes. (a) Surface roughness; (b) cross-section morphologies
Fig. 10. Schematics of surface levelling after EJM under direct-current mode. (a) Transpassive dissolution stage; (b) salt film levelling stage
Fig. 11. Equivalent circuit based on RC model in EJM
Fig. 12. Schematics of surface leveling after EJM under pulse current mode. (a) Transpassive dissolution stage; (b) salt film levelling stage; (c) salt film disappearing stage
Fig. 13. Waveform diagrams of pulse voltage during EJM. (a) Waveform diagram at 30000 Hz; (b) double-layer charging; (c) double-layer discharging
|
Table 1. Chemical compositions of Inconel 718 alloy powder
|
Table 2. Experimental parameters under different pulse frequencies during EJM
|
Table 3. Experimental parameters under different pulse duty ratios during EJM
|
Table 4. Experimental parameters under different current modes during EJM

Set citation alerts for the article
Please enter your email address
© Copyright 2018-2021 | Chinese Laser Press. All Rights Reserved 沪ICP备15018463号-20