
Dong YAO, Bo GAO, Yingzheng SONG, Qun LI, Guilong GAO. Research on Ultrasonic Response Characteristics of Structures Excited by Laser Transient Grating[J]. Acta Photonica Sinica, 2022, 51(9): 0914001
- Acta Photonica Sinica
- Vol. 51, Issue 9, 0914001 (2022)
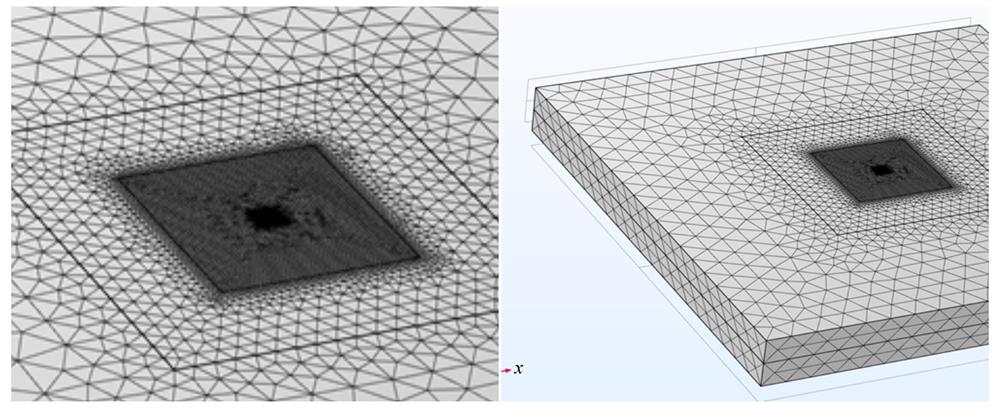
Fig. 1. Grid discrete case
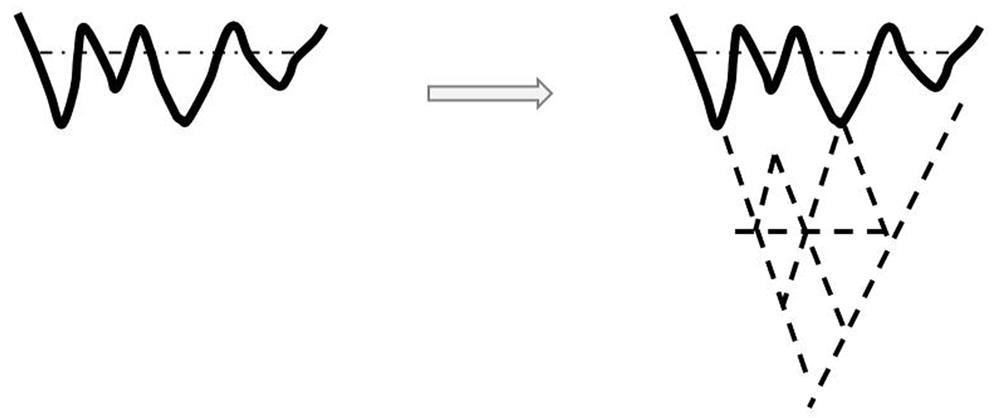
Fig. 2. Treatment of rough surface with inverted triangle and downward folding
Fig. 3. Observation point deployment and reference frame schematic
Fig. 4. Surface longitudinal displacement nephogram at time 1μs
Fig. 5. Comparison of longitudinal displacements at different distances from the center point along the X direction
Fig. 6. Comparison of longitudinal displacements at different distances from the center point along the Y direction
Fig. 7. Comparison of displacement responses in different directions
Fig. 8. Comparison of longitudinal displacements at 1 mm from the center under three excitation modes
Fig. 9. Comparison of longitudinal displacements at 2 mm from the center under three excitation modes
Fig. 10. Comparison of longitudinal displacements at 4 mm from the center under three excitation modes
Fig. 11. Experimental principle of laser transient grating excitation aluminum plate
Fig. 12. Experimental device layout and excitation - detection light circuit diagram
Fig. 13. The original displacement data of transient grating excitation
Fig. 14. Comparison between measured and simulated data of observation point displacement
|
Table 1. Parameter value
|
Table 2. Peak displacement data at different distances along X axis and Y axis
| ||||||||||||||||||||||||||||||||||||||||||||||||||||
Table 3. Comparison of feature data in different excitation modes

Set citation alerts for the article
Please enter your email address
© Copyright 2018-2021 | Chinese Laser Press. All Rights Reserved 沪ICP备15018463号-20