Author Affiliations
1Key Laboratory of Regional Sustainable Development Modeling, Institute of Geographic Sciences and Natural Resources Research, CAS, Beijing 100101, China2College of Resources and Environment, University of Chinese Academy of Sciences, Beijing 100049, Chinashow less
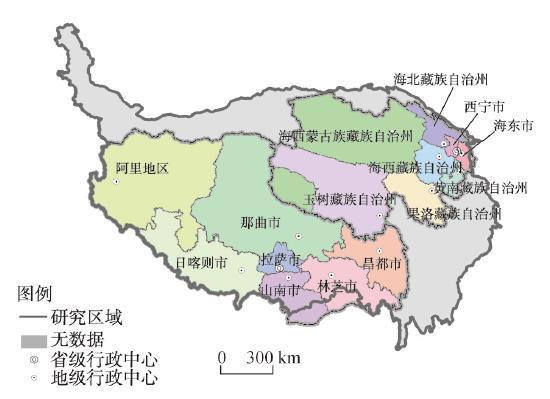
Fig. 1. The study area of Tibetan Plateau
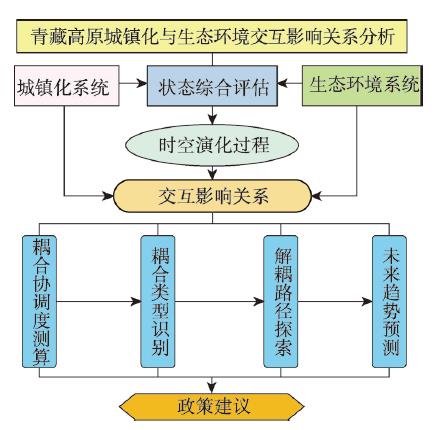
Fig. 2. Framework of research on the interaction between urbanization and eco-environment in the Tibetan Plateau
Fig. 3. Temporal evolution of comprehensive evaluation index of the Tibetan Plateau, Qinghai and Tibet from 2000 to 2015
Fig. 4. Temporal evolution of comprehensive evaluation index of urbanization for each prefecture-level city in the Tibetan Plateau from 2000 to 2015
Fig. 5. Spatial evolution of evaluation index of urbanization for each prefecture-level city in the Tibetan Plateau from 2000 to 2015
Fig. 6. Temporal evolution of evaluation index of eco-environment for each prefecture-level city in the Tibetan Plateau from 2000 to 2015
Fig. 7. Spatial evolution of evaluation index of eco-environment for each prefecture-level city in the Tibetan Plateau from 2000 to 2015
Fig. 8. Temporal evolution of coupling coordination degree in the Tibetan Plateau, Qinghai and Tibet from 2000 to 2015
Fig. 9. Temporal evolution of coupling coordination degree for each prefecture-level city in the Tibetan Plateau from 2000 to 2015
Fig. 10. Coupling types of urbanization and eco-environment for each prefecture-level city in the Tibetan Plateau
Fig. 11. Decoupling relationship between eco-environment index and urbanization index for each prefecture-level city in the Tibetan Plateau
| 熵值法权重 | 层次分析法权重 | 综合权重 | 指标层 | 熵值法权重 | 层次分析法权重 | 综合权重 |
|---|
| 人口城镇化 | 0.1991 | 0.1238 | 0.1582 | 城镇人口密度(人/km2) | 0.5461 | 0.3333 | 0.4130 | | 城镇人口占比(%) | 0.5518 | 0.6667 | 0.5870 | | 经济城镇化 | 0.4027 | 0.3875 | 0.3981 | 人均地区生产总值(万元) | 0.2689 | 0.4704 | 0.3558 | | 第二、三产值占GDP比重(%) | 0.2725 | 0.2797 | 0.2762 | | 财政收入占地区生产总值比重(%) | 0.2721 | 0.1142 | 0.1764 | | 全社会固定资产投资总额(万元) | 0.2699 | 0.1358 | 0.1916 | | 空间城镇化 | 0.1050 | 0.1011 | 0.1038 | 每万人城市建成区面积(km2) | 1.0000 | 1.0000 | 1.0000 | | 社会城镇化 | 0.2996 | 0.3875 | 0.3398 | 城镇居民人均可支配收入(元) | 0.3695 | 0.5499 | 0.4369 | | 每万人拥有卫生机构数量(个) | 0.3797 | 0.2098 | 0.2735 | | 社会消费品零售总额(万元) | 0.3719 | 0.2402 | 0.2896 |
|
Table 1. Comprehensive evaluation indexes of urbanization and index weight
| 准则层 | 熵值法权重 | 层次分析法权重 | 综合权重 | 指标层 | 熵值法权重 | 层次分析法权重 | 综合权重 |
|---|
| 生态系统结构 | 0.3709 | 0.3145 | 0.3464 | 草地覆盖率(%)(+) | 0.2182 | 0.2234 | 0.2209 | | 湿地占比(%)(+) | 0.2019 | 0.1829 | 0.1923 | | 森林覆盖率(%)(+) | 0.1677 | 0.1688 | 0.1684 | | 冰川占比(%)(+) | 0.1968 | 0.1829 | 0.1898 | | 植被覆盖指数(+) | 0.2155 | 0.2420 | 0.2285 | | 生态环境功能 | 0.1480 | 0.2845 | 0.2081 | 生态空间占比(%)(+) | 0.5412 | 0.4013 | 0.4707 | | 生态系统服务价值(元)(+) | 0.4588 | 0.5987 | 0.5293 | | 生态环境压力 | 0.2470 | 0.2005 | 0.2257 | PM2.5平均浓度(μg)(-) | 0.3317 | 0.2702 | 0.3001 | | CO2排放量(万t)(-) | 0.3339 | 0.3528 | 0.3440 | | 生物栖息地侵占量(hm2)(-) | 0.3345 | 0.3771 | 0.3560 | | 生态环境格局 | 0.2341 | 0.2005 | 0.2197 | 景观破碎度(-) | 0.3446 | 0.3548 | 0.3502 | | 景观连通性(+) | 0.3166 | 0.3548 | 0.3356 | | 景观多样性(+) | 0.3388 | 0.2905 | 0.3142 |
|
Table 2. Comprehensive evaluation indexes of eco-environment and index weight
| 大类 | 协调发展度 | 亚类 | F(x)与G(y)对比关系 | 基本类型 |
|---|
| 协调发展类 | 0.60~1.00 | 协调发展类(Ⅳ) | F(x)-G(y) > 0.1 | 协调发展类生态环境滞后型(Ⅳ-1) | | |F(x)-G(y)| ≤ 0.1 | 协调发展类城镇化生态环境同步型(Ⅳ-2) | | G(y)-F(x) > 0.1 | 协调发展城镇化滞后型(Ⅳ-3) | | 过渡类 | 0.50~0.59 | 勉强协调发展类(Ⅲ) | F(x)-G(y) > 0.1 | 勉强协调发展类生态环境滞后型(Ⅲ-1) | | |F(x)-G(y)| ≤ 0.1 | 勉强协调发展类城镇化生态环境同步型(Ⅲ-2) | | G(y)-F(x) > 0.1 | 勉强协调发展类城镇化滞后型(Ⅲ-3) | | 0.40~0.49 | 濒临失调衰退类(Ⅱ) | F(x)-G(y) > 0.1 | 濒临失调衰退类生态环境滞后型(Ⅱ-1) | | |F(x)-G(y)| ≤ 0.1 | 濒临失调衰退类城镇化生态环境共损型(Ⅱ-2) | | G(y)-F(x) > 0.1 | 濒临失调衰退类城镇化滞后型(Ⅱ-3) | | 失调类 | 0.00~0.39 | 失调衰退类(Ⅰ) | F(x)-G(y) > 0.1 | 失调衰退类生态环境滞后型(Ⅰ-1) | | |F(x)-G(y)| ≤ 0.1 | 失调衰退类城镇化生态环境共损型(Ⅰ-2) | | G(y)-F(x) > 0.1 | 失调衰退类城镇化滞后型(Ⅰ-3) |
|
Table 3. Classification standards of coordinated development in urbanization and eco-environment
| 状态 | 生态环境指数增长率 | 城镇化指数增长率 | 脱钩指数DI |
|---|
| 脱钩 | 衰退脱钩 | - | - | DI ≥ 1.2 | | 强脱钩 | - | + | DI < 0 | | 弱脱钩 | + | + | 0 ≤ DI < 0.8 | | 连接 | 扩张连接 | + | + | 0.8 ≤ DI < 1.2 | | 衰退连接 | - | - | 0.8 ≤ DI < 1.2 | | 负脱钩 | 扩张负脱钩 | + | + | DI ≥ 1.2 | | 强负脱钩 | + | - | DI < 0 | | 弱负脱钩 | - | - | 0 ≤ DI < 0.8 |
|
Table 4. Classification standards of decoupling states
| 2000 | 2001 | 2002 | 2003 | 2004 | 2005 | 2006 | 2007 |
|---|
| 青藏高原 | Ⅱ-3 | Ⅱ-3 | Ⅱ-3 | Ⅱ-3 | Ⅱ-3 | Ⅱ-3 | Ⅲ-3 | Ⅲ-3 | | 青海省 | Ⅱ-3 | Ⅱ-3 | Ⅱ-3 | Ⅲ-3 | Ⅲ-3 | Ⅲ-3 | Ⅲ-3 | Ⅲ-3 | | 西藏自治区 | Ⅱ-3 | Ⅱ-3 | Ⅱ-3 | Ⅱ-3 | Ⅱ-3 | Ⅱ-3 | Ⅱ-3 | Ⅲ-3 | | 2008 | 2009 | 2010 | 2011 | 2012 | 2013 | 2014 | 2015 | | 青藏高原 | Ⅲ-3 | Ⅲ-3 | Ⅲ-3 | Ⅲ-3 | Ⅳ-3 | Ⅳ-3 | Ⅳ-2 | Ⅳ-2 | | 青海省 | Ⅲ-3 | Ⅲ-3 | Ⅳ-2 | Ⅳ-2 | Ⅳ-2 | Ⅳ-2 | Ⅳ-1 | Ⅳ-1 | | 西藏自治区 | Ⅲ-3 | Ⅲ-3 | Ⅲ-3 | Ⅲ-3 | Ⅳ-3 | Ⅳ-3 | Ⅳ-3 | Ⅳ-3 |
|
Table 5. Coupling types of urbanization and eco-environment in the Tibetan Plateau, Qinghai and Tibet
| 年份 | ΔE | ΔU | DI | 脱钩程度 |
|---|
| 2001 | -0.02 | 0.01 | -0.35 | 强脱钩 | | 2002 | 0.00 | 0.01 | -0.06 | 弱脱钩 | | 2003 | 0.00 | 0.01 | -0.02 | 弱脱钩 | | 2004 | -0.02 | 0.01 | -0.44 | 强脱钩 | | 2005 | 0.02 | 0.01 | 0.38 | 弱脱钩 | | 2006 | 0.00 | 0.02 | -0.06 | 弱脱钩 | | 2007 | 0.00 | 0.02 | -0.05 | 弱脱钩 | | 2008 | -0.01 | 0.02 | -0.09 | 强脱钩 | | 2009 | 0.00 | 0.02 | -0.04 | 弱脱钩 | | 2010 | -0.02 | 0.03 | -0.23 | 强脱钩 | | 2011 | 0.00 | 0.03 | 0.03 | 弱脱钩 | | 2012 | -0.01 | 0.04 | -0.08 | 强脱钩 | | 2013 | -0.03 | 0.04 | -0.39 | 强脱钩 | | 2014 | -0.04 | 0.04 | -0.69 | 强脱钩 | | 2015 | 0.05 | 0.04 | 0.86 | 扩张连接 |
|
Table 6. The growth rates of eco-environment index and urbanization index and their decoupling relationship in the Tibetan Plateau
| 年份 | 地区 | ΔE | ΔU | DI | 状态 | 地区 | ΔE | ΔU | DI | 状态 |
|---|
| 2001 | 青海 | -0.0214 | 0.0134 | -0.5817 | 强脱钩 | 西藏 | -0.0009 | 0.0172 | -0.0118 | 强脱钩 | | 2002 | 青海 | 0.0041 | 0.0095 | 0.1747 | 弱脱钩 | 西藏 | -0.0073 | 0.0144 | -0.1317 | 强脱钩 | | 2003 | 青海 | -0.0024 | 0.0101 | -0.0997 | 强脱钩 | 西藏 | 0.0041 | 0.0100 | 0.1176 | 弱脱钩 | | 2004 | 青海 | -0.0234 | 0.0089 | -1.1814 | 强脱钩 | 西藏 | 0.0009 | 0.0094 | 0.0275 | 弱脱钩 | | 2005 | 青海 | 0.0243 | 0.0152 | 0.7844 | 弱脱钩 | 西藏 | 0.0003 | 0.0072 | 0.0142 | 弱脱钩 | | 2006 | 青海 | -0.0049 | 0.0178 | -0.1381 | 强脱钩 | 西藏 | -0.0006 | 0.0129 | -0.0159 | 强脱钩 | | 2007 | 青海 | -0.0054 | 0.0214 | -0.1362 | 强脱钩 | 西藏 | -0.0016 | 0.0330 | -0.0167 | 强脱钩 | | 2008 | 青海 | -0.0049 | 0.0231 | -0.1254 | 强脱钩 | 西藏 | -0.0018 | 0.0167 | -0.0437 | 强脱钩 | | 2009 | 青海 | 0.0013 | 0.0229 | 0.0356 | 弱脱钩 | 西藏 | -0.0017 | 0.0188 | -0.0383 | 强脱钩 | | 2010 | 青海 | -0.0146 | 0.0319 | -0.3197 | 强脱钩 | 西藏 | -0.0009 | 0.0251 | -0.0168 | 强脱钩 | | 2011 | 青海 | 0.0034 | 0.0408 | 0.0662 | 弱脱钩 | 西藏 | -0.0004 | 0.0238 | -0.0094 | 强脱钩 | | 2012 | 青海 | -0.0014 | 0.0421 | -0.0280 | 强脱钩 | 西藏 | -0.0028 | 0.0322 | -0.0481 | 强脱钩 | | 2013 | 青海 | -0.0260 | 0.0400 | -0.6294 | 强脱钩 | 西藏 | -0.0029 | 0.0374 | -0.0463 | 强脱钩 | | 2014 | 青海 | -0.0454 | 0.0414 | -1.2288 | 强脱钩 | 西藏 | -0.0096 | 0.0345 | -0.1862 | 强脱钩 | | 2015 | 青海 | 0.0500 | 0.0404 | 1.6851 | 扩张负脱钩 | 西藏 | 0.0053 | 0.0536 | 0.0730 | 弱脱钩 |
|
Table 7. The growth rates of eco-environment index and urbanization index and their decoupling relationship in Qinghai and Tibet
| 预测单元 | 青藏高原 | 青海 | 西藏 | 阿里 | 昌都 | 果洛 | 海北 | 海东 | 海南 |
|---|
| 平均相对误差(%) | 1.76 | 1.97 | 1.97 | 2.57 | 0.83 | 0.94 | 2.32 | 1.56 | 2.47 | | 相对精度(%) | 98.24 | 98.02 | 98.04 | 97.42 | 99.16 | 99.06 | 97.67 | 98.44 | 97.53 | | C值 | 0.07 | 0.17 | 0.09 | 0.12 | 0.06 | 0.06 | 0.08 | 0.13 | 0.14 | | 预测单元 | 海西 | 黄南 | 拉萨 | 林芝 | 那曲 | 日喀则 | 山南 | 西宁 | 玉树 | | 平均相对误差(%) | 3.41 | 1.22 | 1.07 | 1.05 | 1.42 | 0.90 | 0.55 | 1.02 | 2.54 | | 相对精度(%) | 96.58 | 98.77 | 98.93 | 98.95 | 98.57 | 99.10 | 99.45 | 98.98 | 97.47 | | C值 | 0.43 | 0.06 | 0.07 | 0.07 | 0.12 | 0.05 | 0.04 | 0.12 | 0.10 |
|
Table 8. Prediction accuracies of future changes in coupling coordination degree of urbanization and eco-environment in the Tibetan Plateau
| 预测单元 | 青藏高原 | 青海 | 西藏 | 阿里 | 昌都 | 果洛 | 海北 | 海东 | 海南 |
|---|
| 2020年预测值 | 0.81 | 0.76 | 0.78 | 0.84 | 0.69 | 0.81 | 0.81 | 0.68 | 0.75 | | 2025年预测值 | 0.96 | 0.85 | 0.90 | 0.98 | 0.80 | 0.96 | 0.95 | 0.76 | 0.86 | | 预测单元 | 海西 | 黄南 | 拉萨 | 林芝 | 那曲 | 日喀则 | 山南 | 西宁 | 玉树 | | 2020年预测值 | 0.63 | 0.88 | 0.82 | 0.78 | 0.72 | 0.74 | 0.83 | 0.73 | 0.81 | | 2025年预测值 | 0.64 | 0.90 | 0.93 | 0.90 | 0..81 | 0.86 | 0.97 | 0.81 | 0.99 |
|
Table 9. Predictions of future changes in coupling coordination degree of urbanization and eco-environment in the Tibetan Plateau