
Weihong Cen, Huiliang Tang, Jiangzhao Zhang, Guixin Yuan, Honghao Yan, Yu Long. Scanning Strategy to Improve the Overlapping Quality of Partition in Selective Laser Melting[J]. Chinese Journal of Lasers, 2021, 48(18): 1802018
- Chinese Journal of Lasers
- Vol. 48, Issue 18, 1802018 (2021)
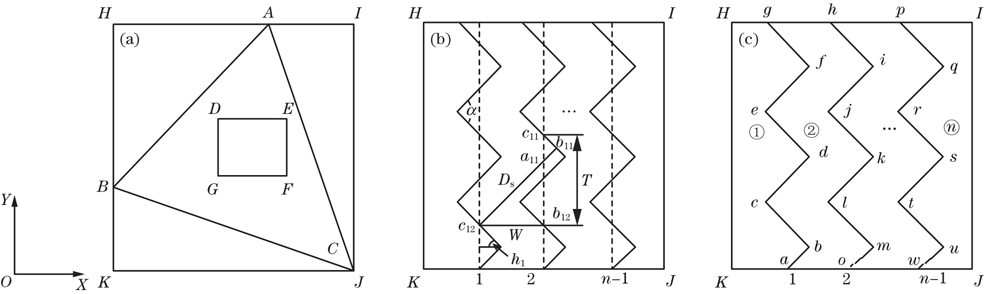
Fig. 1. The generation process of stripe contour. (a) Generating the smallest bounding box; (b) generation process along the Y axis; (c) wave_stride
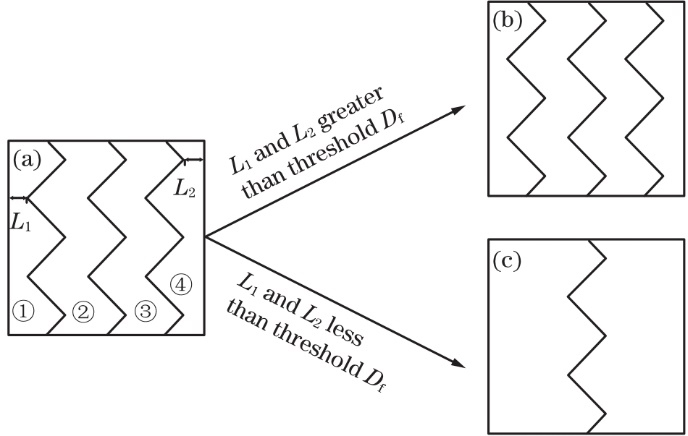
Fig. 2. Schematic of partition merging. (a) Initial partition; (b) partitions with L1 and L2 greater than the threshold Df; (c) partitions with L1 and L2 less than the threshold Df
Fig. 3. Scanning line generation and area filling. (a) Intersection of slice profile and wave_stripe; (b) wave_stripe profile after the intersection; (c) the smallest bounding box of each wave_stripe; (d) schematic of filling the scanning line
Fig. 4. The schematic of generating scanning paths and optimizing beginning and end points of scanning paths. (a) Generating scanning paths; (b) optimizing beginning and end points of scanning paths;(c) the result of scanning paths and beginning and end points of scanning paths in wave_stripe
Fig. 5. The schematic of three scanning strategies and their overlap ways. (a) Wave_stripe scanning; (b) stripe scanning; (c) chessboard scanning; (e) the overlap of wave_stripe; (f) the overlap of stripe; (g) the overlap of chessboard
Fig. 6. Schematic of tensile specimen
Fig. 7. Schematic of overhanging cantilever. (a) Overhanging cantilever specimen; (b) specimen design
Fig. 8. Surface morphology of sample overlap area. (a) Wave_stripe scanning strategy; (b) stripe scanning strategy; (c) two overlap area in the chessboard scanning strategy; (d) four overlap area in the chessboard scanning strategy
Fig. 9. Subsurface morphology of pores by different scanning strategies. (a) Wave_stripe scanning; (b) stripe scanning; (c) chessboard scanning
Fig. 10. Sample deflection with different scanning strategies
Fig. 11. Comparison of efficiency of space filling for samples fabricated by different scanning strategies
Fig. 12. Comparison of tensile stresses of samples changed with elongation using different scanning strategies
Fig. 13. Comparison of hardness of samples with different scanning strategies

Set citation alerts for the article
Please enter your email address
© Copyright 2018-2021 | Chinese Laser Press. All Rights Reserved 沪ICP备15018463号-20