• Acta Physica Sinica
  • Vol. 69, Issue 7, 074502-1 (2020)
Heng Ding, Jing-Wen Zhou, Xiao-Yan Zheng*, Hai-Jian Bai, and Wei-Hua Zhang
Author Affiliations
  • School of Automobile and Traffic Engineering, Hefei University of Technology, Hefei 230009, China
  • show less
    DOI: 10.7498/aps.69.20191641 Cite this Article
    Heng Ding, Jing-Wen Zhou, Xiao-Yan Zheng, Hai-Jian Bai, Wei-Hua Zhang. Macroscopic basic characteristics of a road network under the influence of traffic generation and attraction source agglomeration[J]. Acta Physica Sinica, 2020, 69(7): 074502-1 Copy Citation Text show less
    MFD: (a) Basic characteristics of MFD; (b) state classification of MFD curve.
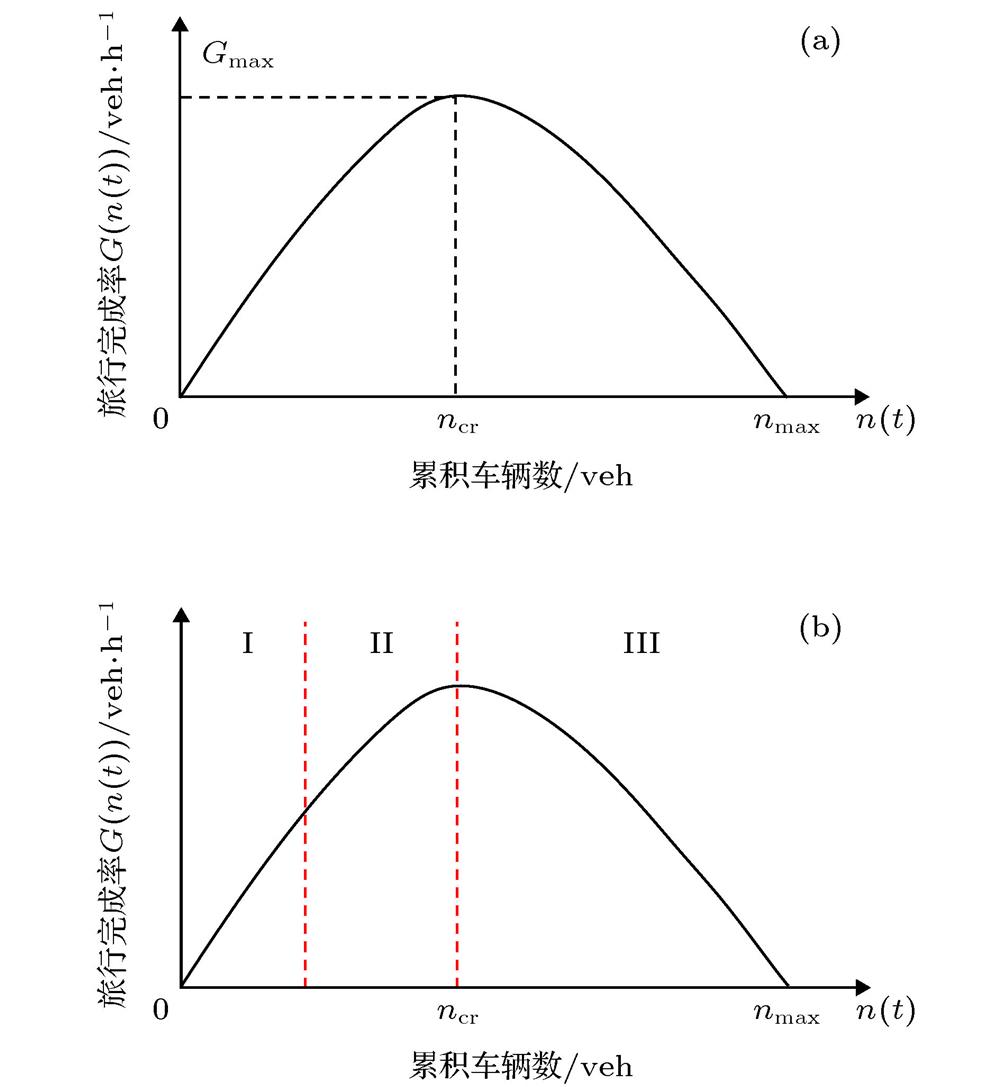
    Fig. 1. MFD: (a) Basic characteristics of MFD; (b) state classification of MFD curve.
    Simulation road network.
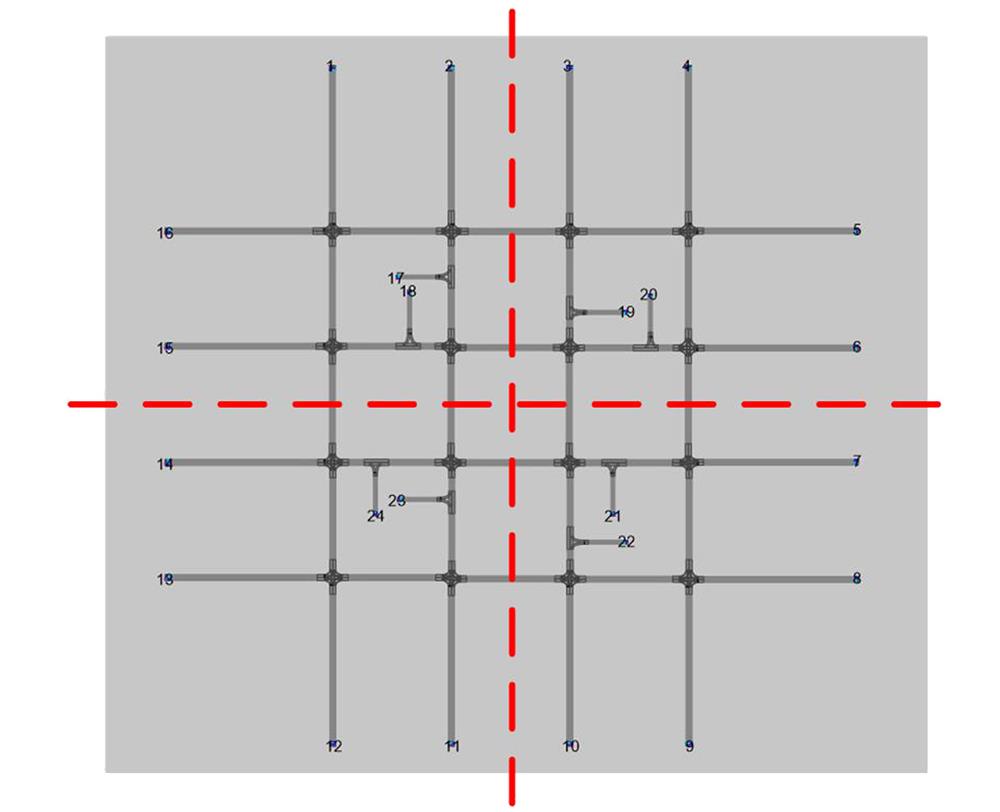
    Fig. 2. Simulation road network.
    Traffic density distribution under different traffic generation and attraction sources.
    Fig. 3. Traffic density distribution under different traffic generation and attraction sources.
    MFDs under different traffic generation and attraction source scale: (a) 800 pcu·h–1; (b) 1200 pcu·h–1; (c) 2000 pcu·h–1.
    Fig. 4. MFDs under different traffic generation and attraction source scale: (a) 800 pcu·h–1; (b) 1200 pcu·h–1; (c) 2000 pcu·h–1.
    MFDs and aggregation degree curves under different traffic generation and attraction source configuration: (a1) MFDof group A simulation scheme; (a2) aggregation degree curve of group A simulation scheme; (b1) MFDof group B simulation scheme; (b2) aggregation degree curve of group B simulation scheme; (b1) MFDof group C simulation scheme; (b2) aggregation degree curve of group C simulation scheme.
    Fig. 5. MFDs and aggregation degree curves under different traffic generation and attraction source configuration: (a1) MFDof group A simulation scheme; (a2) aggregation degree curve of group A simulation scheme; (b1) MFDof group B simulation scheme; (b2) aggregation degree curve of group B simulation scheme; (b1) MFDof group C simulation scheme; (b2) aggregation degree curve of group C simulation scheme.
    交通发生吸引源配置方案12345
    初始聚集度–0.142–0.146–0.182–0.082–0.009
    停车场规模配置情况/pcu·h–120389327238
    40725820371
    602791215050
    80123744986
    1004680322408
    12038132150530
    14010814749389
    2409695105428
    Table 1.

    Traffic generation and attraction source configuration parameters.

    交通发生吸引源配置参数

    吸引源规模/pcu·h–1MFD拟合参数${R^2}$
    ${a_i}$${b_i}$${c_i}$${d_i}$
    8002 × 10–8–0.00020.8434192.340.876
    12002 × 10–8–0.00020.8742190.750.888
    20002 × 10–8–0.00030.9424188.860.901
    Table 2. [in Chinese]
    实验编号ABC
    停车场总规模/pcu·h–180012002000
    实验组数123123123
    初始聚集度–0.142–0.146–0.182–0.082–0.144–0.171–0.009–0.104–0.151
    停车场规模/pcu·h–12038932721387038100268
    40725820324530071170189
    60279121503672105014099
    8012374491036586200304
    100468032217970408260341
    1203813215048130530290107
    1401081474937220389350402
    240969510583135428490290
    Table 3. [in Chinese]
    实验组MFD拟合参数${R^2}$
    ${a_i}$${b_i}$${c_i}$${d_i}$
    A1组3 × 10⁻⁸–0.00031.0743111.660.951
    A2组3 × 10⁻⁸–0.00041.0819111.440.960
    A3组3 × 10⁻⁸–0.00031.0588116.90.953
    B1组5 × 10⁻⁸–0.00051.332761.380.982
    B2组3 × 10⁻⁸–0.00041.0518125.810.967
    B3组2 × 10⁻⁸–0.00030.9445152.790.934
    C1组5 × 10⁻⁸–0.00051.308184.820.942
    C2组4 × 10⁻⁸–0.00051.21321100.929
    C3组4 × 10⁻⁸–0.00051.2579100.650.927
    Table 4. [in Chinese]
    实验编号平均旅行完成率 变化率/% 交通流状态
    A(A3–A1)/A10.773.1330.96
    (A3–A2)/A20.611.143.29
    (A2–A1)/A10.161.9626.79
    B(B3–B1)/B1–0.11–0.5134.36
    (B3–B2)/B2–0.020.247.45
    (B2–B1)/B1–0.09–0.7425.05
    C(C3–C1)/C10.101.5214.87
    (C3–C2)/C20.411.176.01
    (C2–C1)/C1–0.310.348.36
    Table 5. [in Chinese]
    Heng Ding, Jing-Wen Zhou, Xiao-Yan Zheng, Hai-Jian Bai, Wei-Hua Zhang. Macroscopic basic characteristics of a road network under the influence of traffic generation and attraction source agglomeration[J]. Acta Physica Sinica, 2020, 69(7): 074502-1
    Download Citation